Ian Book had a strange season in his second year as a starter, winning 11 games yet struggling with consistency and seeing a decline in all major passing stats. The Notre Dame passing offense as a whole was less productive and efficient compared to 2018 but finished the year on a strong note. What led to the choppy performances of last season, and how can the passing game hope to find steady success while replacing its top three receivers?
This is the second post in a multi-part series breaking down the ND rushing offense and defense, passing offense and defense, and then a high-level review that will include turnovers, special teams, and more. As usual garbage time is excluded from these numbers, and for ease in comparing 2018 vs 2019 numbers I’ve included only P5 opponents + Navy. If lost, this handy advanced stats glossary will help if needed.
Past posts, in case you missed them:
An 11-win rollercoaster for Ian Book
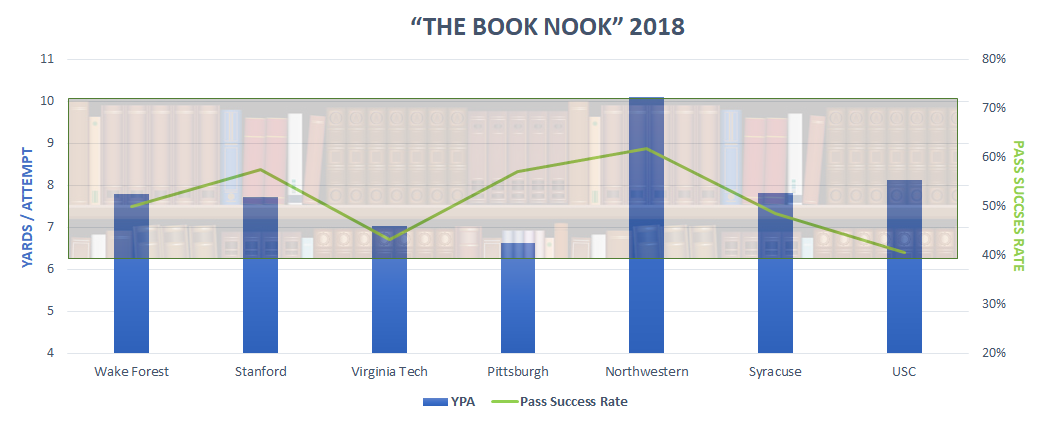
Entering 2019, Book appeared to be a strong foundation for offensive consistency that would bring a high floor to the offense as a whole. The Irish finished 2018 ranked 21st in Passing SP+, fueled by the 15th most efficient passing attack. As impressive as the efficiency was Book’s reliability – in his eight regular-season starts Book had greater than 7 YPA in seven (6.63 vs Pitt was the season-low). Book never dipped below a 41% pass success rate (about the national average) and topped 50% passing success in five starts. Let’s call this range of >40% pass efficiency and 6.5-8.5 YPA the Book Nook.
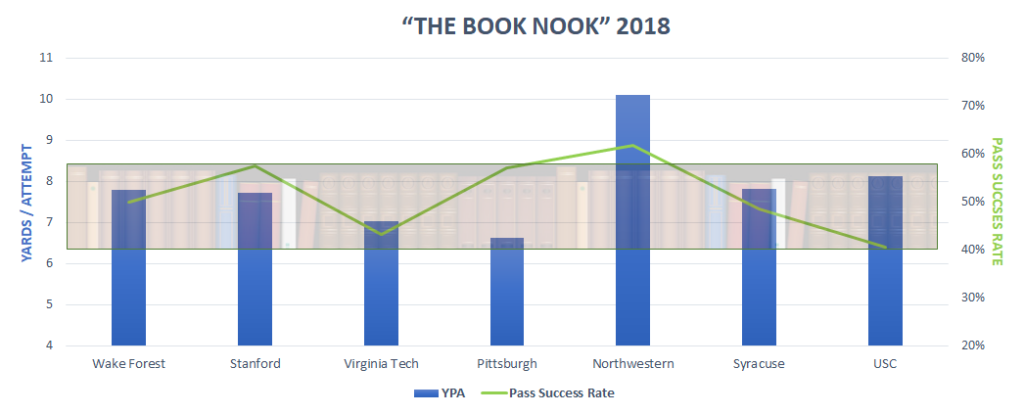
Last season saw Book face a tougher slate of P5 defenses, no doubt. But even against opponents like Virginia, USC, Duke, and Boston College, the passing attack struggled to find consistent production. The junior QB’s five worst pass efficiency performances of his career all came in 2019 – Michigan, UVA, Duke, USC, and UGA. In ten games against P5 competition, Book had lower than 40% pass success in half of his starts and yards per attempt less than 6.5 in seven of ten games.
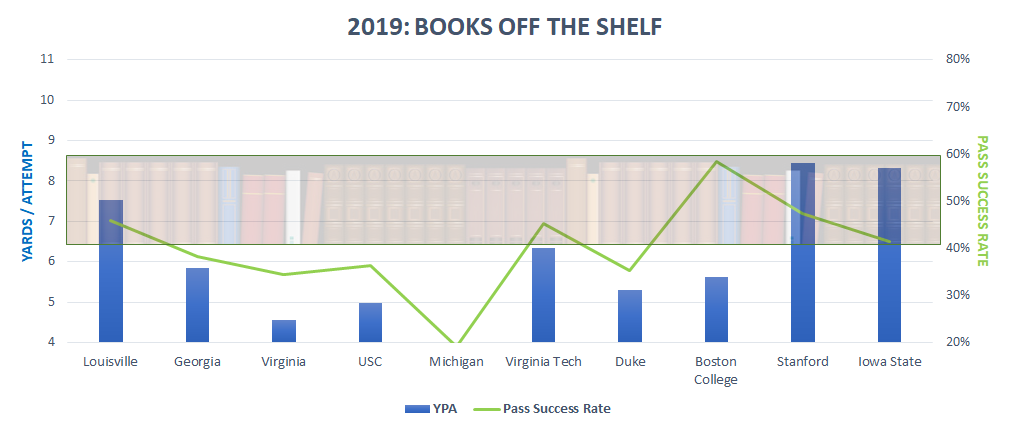
For the season there were similar small declines in each key category – pass success rates fell significantly, yards per pass attempt fell, and explosiveness fell off. Brian Kelly’s second-year QB regression was a worn-out debate by October and felt at times nit-picky when the Irish were still winning. Yet Book’s numbers in traditional numbers fell too – completion percentage, passer rating, with the saving grace being an improved TD to INT ratio.

The upside is that Book seemed to find momentum down the stretch, including three of his best performances of the year in the last few games against Navy, Stanford, and Iowa State. After last season the task for Book was to be more aggressive and a game-changer; down the stretch, the pendulum swung back into the direction of playing to Book’s strengths and setting him up for greater success. Under Tommy Rees’ direction in Orlando, the Irish employed far more “check with me” reads at the line of scrimmage to put the offense in better positions, a rare occurrence in the Chip Long era. The biggest question entering 2020: How can Rees and company recapture the Book from 2018’s regular season and down the stretch?
At this point I’d argue Book’s arm is a bit overrated and legs a little underrated. Check out this chart below that looks at expected points added (EPA) over the course of the season by each team’s QB. EPA essentially looks at each individual play and using historical data calculates how much each one improved your teams’ probability of scoring next and how many points.
Finally got the QBR data loaded. Going to have a lot of fun with this.
For tonight, here’s each QB’s run and passing contribution to QBR:
— parker (@statsowar) March 10, 2020
EPA doesn’t include any accounting for strength of schedule, but it’s an interesting chart to challenge our perceptions of Book and other QBs. Book generally is…much like App State’s Zac Thomas? A worse passing Sam Ehlinger or Bryce Perkins? A Jack Coan, Shea Patterson, or Jacob Eason with a bigger rushing impact?
Pass Protection should be ELITE
For as skilled and experienced as Notre Dame fans are at constructing doomsday scenarios, it’s hard to imagine many where pass protection is an issue in 2020. The Irish were 16th in sack rate allowed (3.6% of dropbacks) and 9th in passing down sack rate allowed. Even in 2018 with significant personnel change the Irish were 38th in sack rate allowed and top 20 in passing down sack rate (16th).
One caveat here is that there’s growing evidence in NFL analytics circles that sacks are potentially more quarterback-driven than you might assume. Mobile quarterbacks tend to see one of their drawbacks being a higher sack rate. Anecdotally the 2017 ND offense supports this case – despite the nation’s best offensive line, with Brandon Wimbush the Irish were 65th in adjusted sack rate, including 88th on passing downs. The importance of the QB in this equation is still good news for the Irish in 2019 as they’ve posted terrific sack rates with Book at the helm of the offense, but if there’s a QB change, worth monitoring closely.
3rd Down (and long) dropoff
The passing game suffered a slight downturn across the board, but the decline was most pronounced on 3rd down. Both efficiency and explosiveness struggled on third downs where Book had shined the previous year:

A closer look reveals that despite facing a shorter average distance to gain on 3rd downs, the Notre Dame offense drop-off was due to far worse performance on 3rd and short (typically running downs) and long (8+) passing downs. New gameplan for 2020 – only 3rd and mediums.
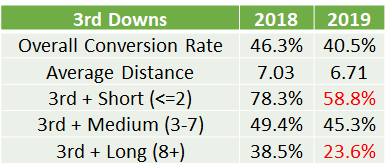
I don’t have a good explanation for this. Some regression to the mean was probably expected, as converting close to 40% of 3rd and 8+ is absurd. But on the field, the only thing that stands out is some of Book’s early skittishness in the pocket that sometimes resulted in scrambles, throwaways, or desperation passes.
Massive receiver turnover is usually bad. Can the Irish be the exception?
If you’ve followed Bill Connelly’s work or this space over the years, you’re likely familiar with the strong correlation between returning receiving yards and offensive performance the following year. Returning receiving yards is tied in importance with returning passing yards in predicting performance, and weighted as five times more important than returning rushing yards. So it sets off a few alarm bells when the offense loses it’s three top receivers, 68% of last year’s catches, and 65% of 2019’s receiving yards.

The departures
It’s a double gut-punch to lose Claypool and Kmet’s combination of efficiency and explosiveness they sustained with high volume. Claypool’s success rate was dampened by some throw-aways and low probability passes toward the sideline, although he made some insane catches on a few anyway. There were also a few games where Book may have force-fed Mapletron a bit (can you blame him?), like 18 targets against Virginia Tech. Both were nightmares for opposing defensive coordinators and will not be easily replaced.
Chris Finke’s lost production from the slot hurts as well, although his efficiency was shaky especially early in the season as he battled injuries. Despite those early struggles his numbers still out-shine a potential replacement like Lawrence Keys, who wasn’t particularly efficient either.
Strong producers about to take on a lot more
Take volume out of the table above and Tommy Tremble’s numbers compare favorably to Kmet’s, including the best success rate when targeted on the team. Tremble may not be the same physical presence but his speed and improved blocking throughout the season provide a reason to believe he too could be a Mackey finalist.
The two guys at the bottom of the list provide the most intrigue. How does Lenzy’s role in the receiving game change with three times as many targets? Can he become a high-efficiency option as well as a big-play threat? And what do we make of Javon McKinley feasting on bad opponents, if he returns for a 5th year?
Can one or two new faces make an impact?
Despite all of the losses and historical data that would tell you there’s a big uphill battle ahead, talking yourself into a smooth overhaul isn’t difficult. Kevin Austin is notably absent from this chart, and it would shock no one if he stepped in and put up 75% of Claypool’s stat line assuming health and traits and such.
Bennett Skowronek as a grad transfer provides a nice insurance policy on the outside too. Book loves the back shoulder throw to a big target, and Skowronek was one of the more explosive receiving threats on Northwestern offenses that have been horrible creating big plays.
Then you have a bunch of other lottery tickets that could hit in the form of young blue-chip talents. Jordan Johnson appears to have no weaknesses and college-level strength already. Xavier Watts is already on campus and pairs with Kendall Abdur-Rahman in the “explosive athletes that could go full Lenzy” category. Recruiting reporters were openly salivating over Michael Mayer at the All-American bowl. Running backs were a virtual non-factor in the passing game last year and Kyren Williams could completely change that if last fall’s practice buzz means anything at all.
Still, the dependence on lottery tickets and a bunch of new faces underscores the potentially low floor. You can squint at the depth chart and feel pretty good, but if Lenzy gets banged up? Or Kevin Austin is in the doghouse in August? It gets dicey very quickly with a lot of potential but few proven efficiency options.

This is great work-thanks for putting it all together.
Yup, I like those stats on Tremble. Although, things could be different without Kmet taking attention away from him.
Also, the Book Nook…..nice.
Yeah interesting that the #2 TE the past couple seasons (Mack/Kmet then Kmet/Tremble) has put up very similar numbers on a per target / catch basis. I’m optimistic Tremble will put up big numbers next year but that doesnt mean necessarily he’ll have as positive of a holistic impact as Kmet, we’ll see what Tommy wants to do with TEs, lots of different skill sets with him, Wright, Mayer
You noted that there is a correlation of success with returning receiver production. Are there any stats that look at QBs who focus on a small set of receivers versus those who spread the ball around to a variety of receivers?
Good question, I’m not aware of it. Returning pass yards and returning receiving yards are equally weighted in Bill’s work so I don’t think it distinguishes between a scenario where a QB loses the same number of yards if spread out among 5 receivers versus 3 receivers (maybe it should!)