Earlier in the year, someone asked SP+ creator Bill Connelly about Notre Dame’s upward move in his model after their uninspiring win over Toledo. Connelly replied as such:
91% postgame win expectancy for ND, equivalent to about a three-score win. Massive success rate advantage and some bad turnovers luck.
SP+ never ever ever says what you think it will about the Irish…https://t.co/LtobmbX5Xm
— Bill Connelly (@ESPN_BillC) September 12, 2021
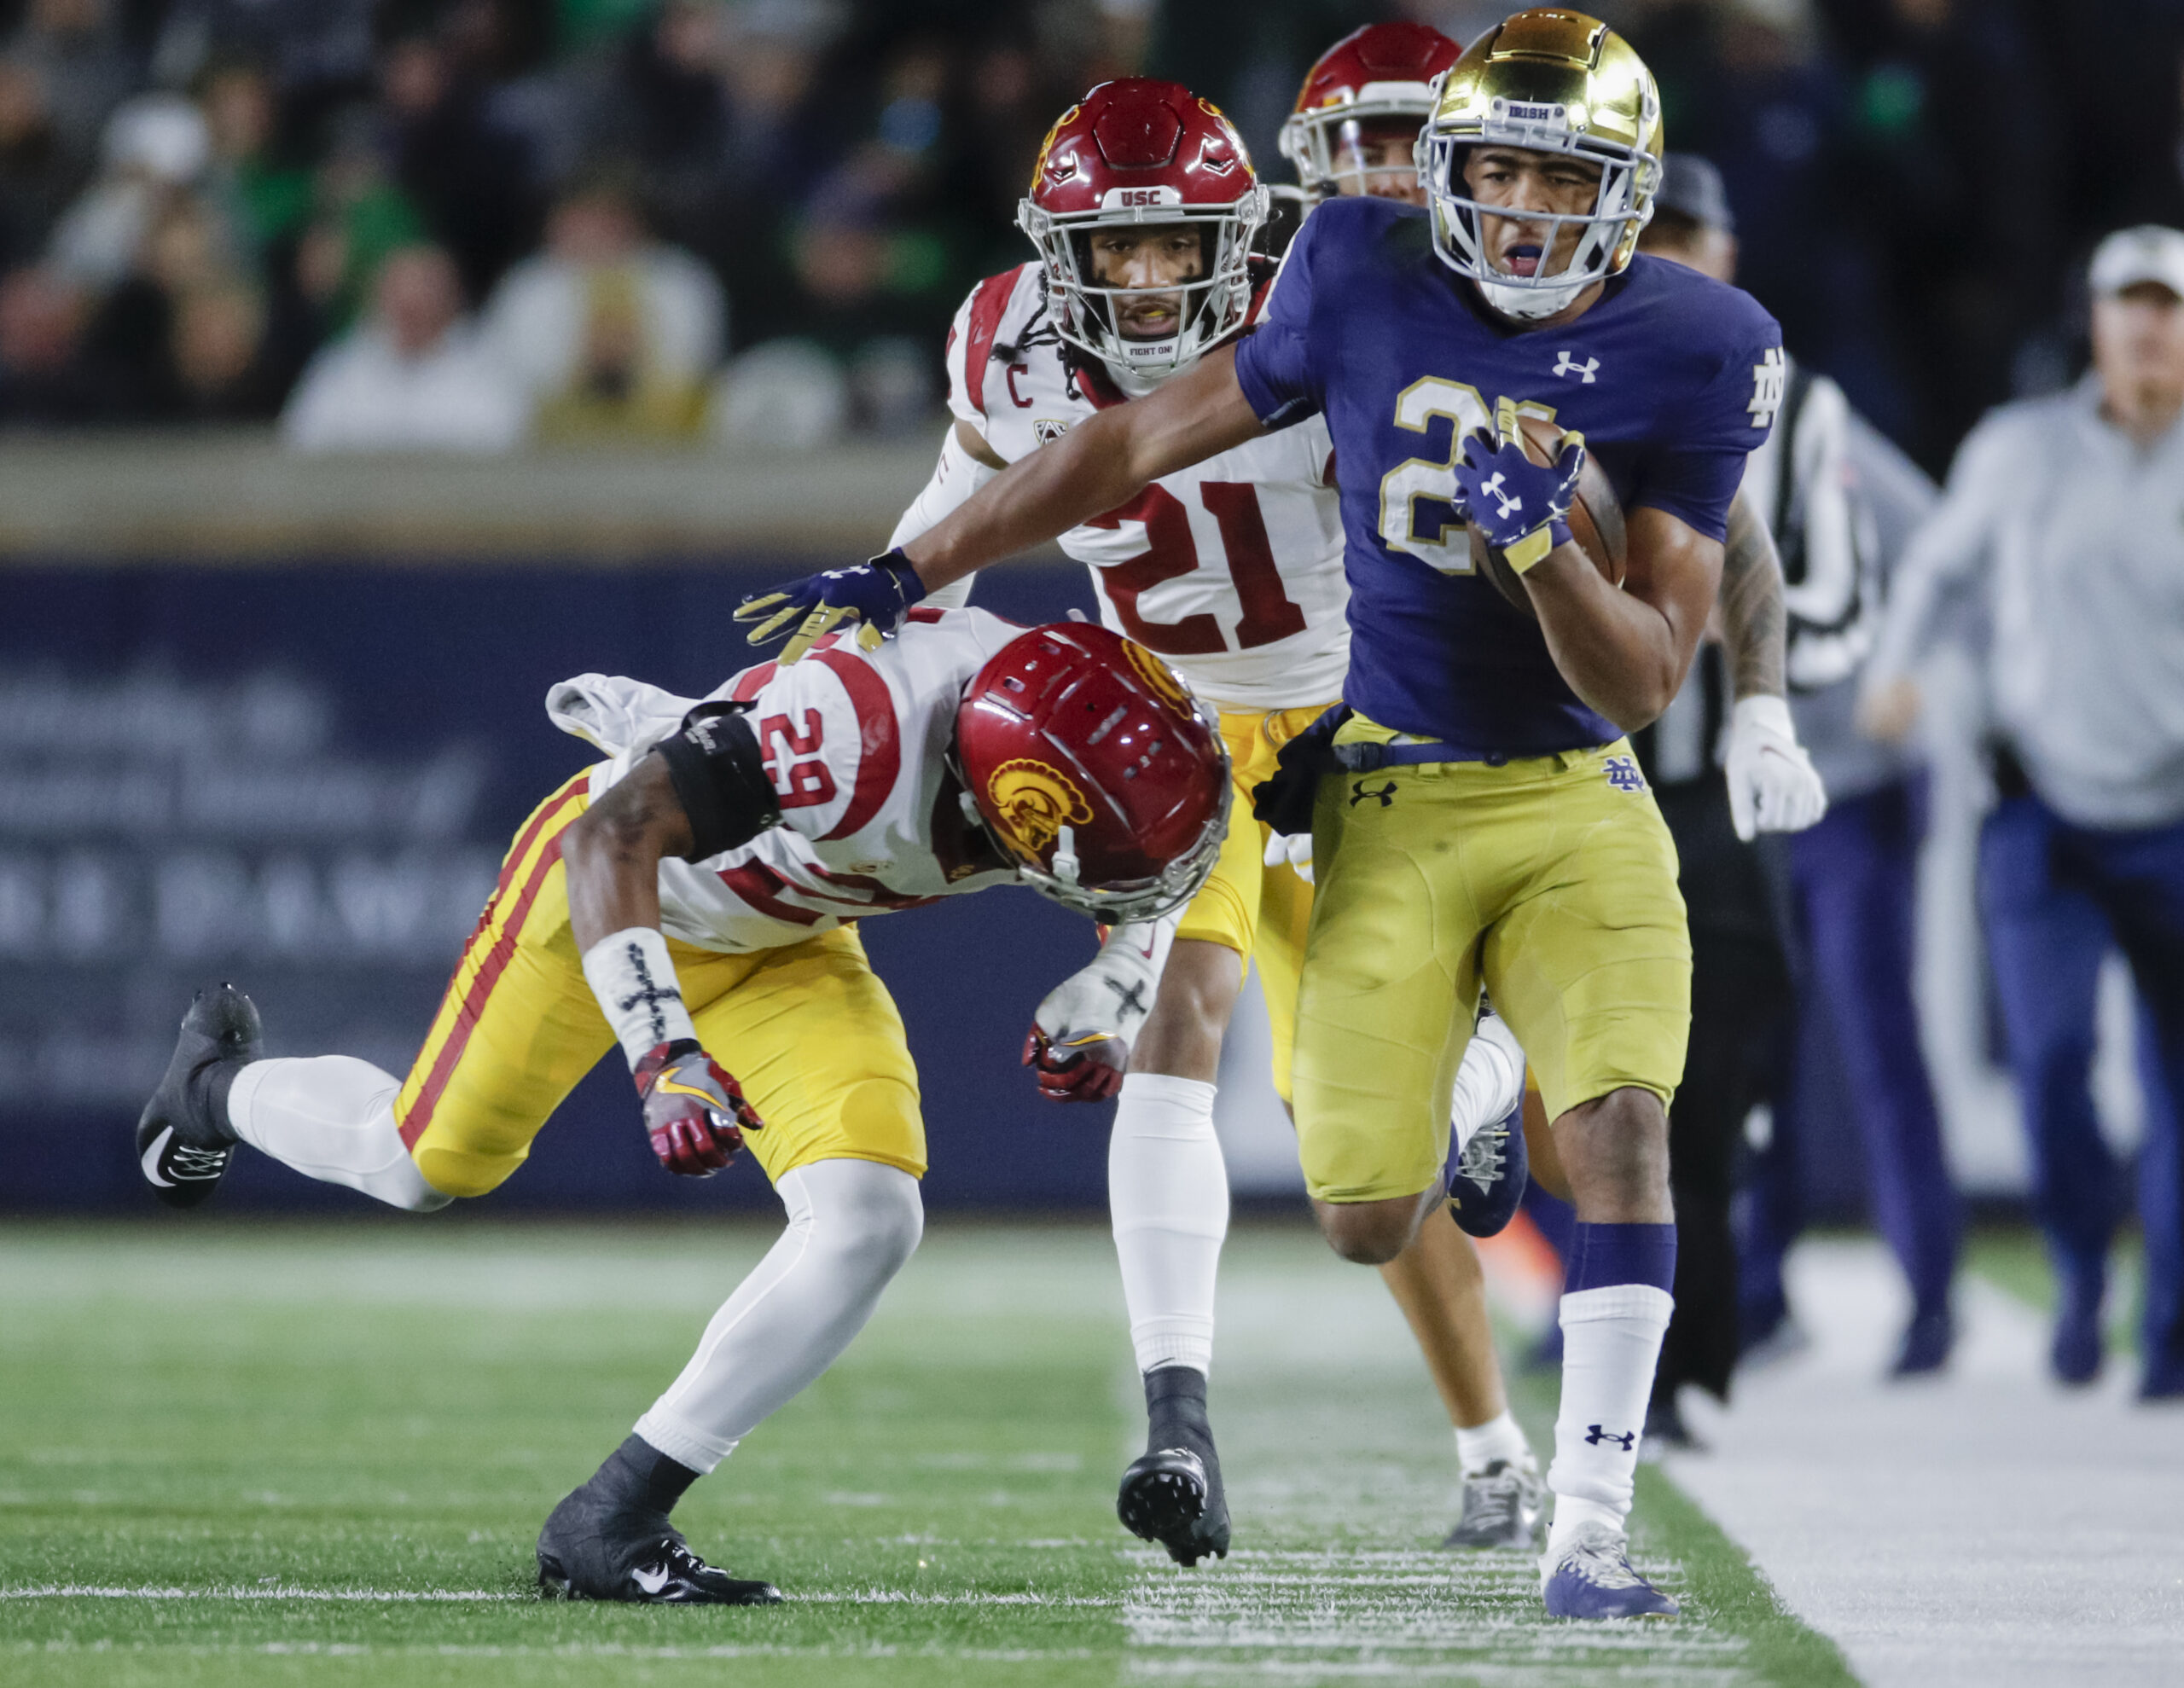
My “SP+ never ever ever says what you think it will about the Irish” shirt has people asking a lot of questions that are already answered by my shirt… Notre Dame, after very much controlling the entire game against USC and kneeling at the USC 10 to close out a two-score win, actually slipped a bit in SP+. I’ll poke SP+ when appropriate, but in this case I get it; it’s a game where the additional context beyond the stats matters tremendously. Notre Dame’s defensive game plan was to yield smaller successes to USC’s offense to avoid dagger plays. Look no farther than stalwart Trojan receiver Drake London, who was targeted 20 times (!) and made 15 catches for 171 yards – but only seven of those catches went for first downs. Yes, it felt like more, but it wasn’t, and that’s a ratio you can live with against a player like that.
That works to control the game, but it also leads to a high offensive success rate for USC. Accordingly, SP+ sees the game as a “bad” performance for the Irish defense. It took a favorable view of the offensive performance, but the effect of that was mitigated by what the model thinks of USC’s defense. So in the end it balances out to a slight drag on the season-long number despite the Irish being thoroughly in control throughout and at times dominating. Context. FPI, as you’ll see below, didn’t change its opinion of the Irish much at all based on that game.
Recapping the methodology for these articles: These aren’t actual SP+ win probabilities, as SP+ creator Bill Connelly doesn’t publish those regularly. He does though publish his SP+ ratings every week for all FBS teams. We use a slightly tweaked version of the formula that Reddit poster rcfbuser (account deleted, pour one out) posted a few years back to approximate the official calculation. The FPI win probabilities are updated weekly by ESPN, so those are the real deal.
SP+ measures offensive and defensive explosiveness and efficiency on a per-play basis. FPI is ESPN’s proprietary metric and is much more of a black box, but we do know that it rests heavily on expected points added, which is a pretty solid advanced stat and also a per-play number.
Post-Week 8 Update – SP+ Matrix
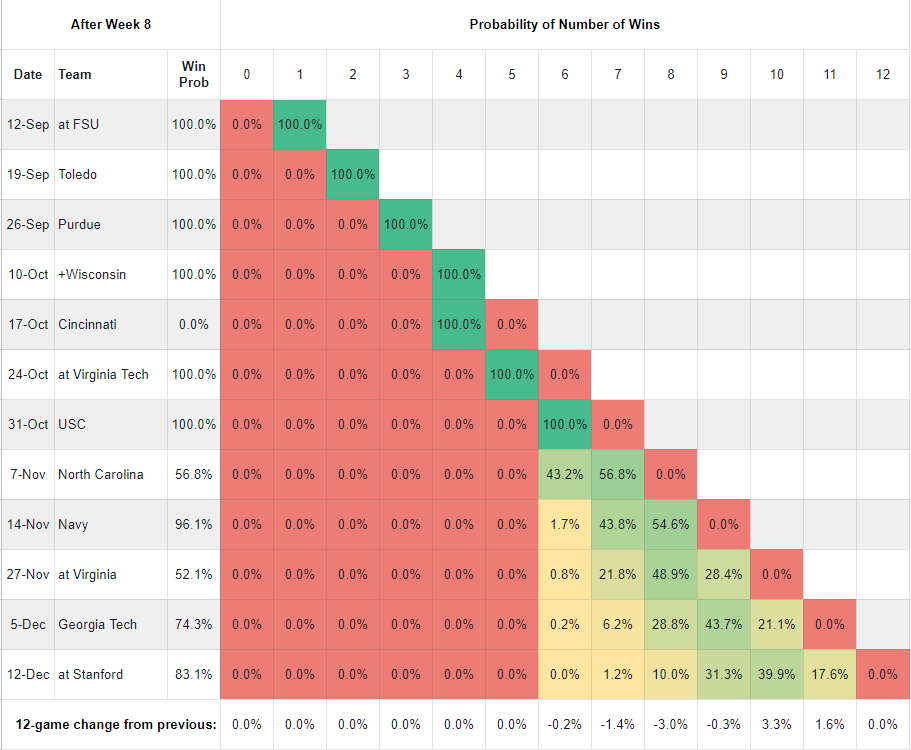
As you move down each column, you find the probability of Notre Dame owning that many wins at that point of the schedule. In the sixth row, for example, you can see that the probability of owning zero or seven wins through seven games is 0%, and of owning six wins is 100%. So, 6-1. In the last row of the table we’re tracking how much the probability of each win total has changed from the previous week. This is a function of our own outcomes, the quality of play that led to those outcomes, and SP+’s changing perceptions of our past and future opponents.
The 17.6% figure at the end of the Stanford row reflects our probability of winning all the remaining games per SP+. That and the probability of going 10-2 are up a bit from last week despite SP+’s slightly diminished view of the Irish due mostly to getting a reasonably dangerous game off the schedule – USC was the third lowest win probability remaining. This is also the week that the last bit of preseason projections fell out for pretty much everyone across the country, so from this point forward the SP+ calculation is only based on actual season performance. I wouldn’t expect much change week to week at this point unless something drastic happens somewhere.
Post-Week 8 Update – FPI
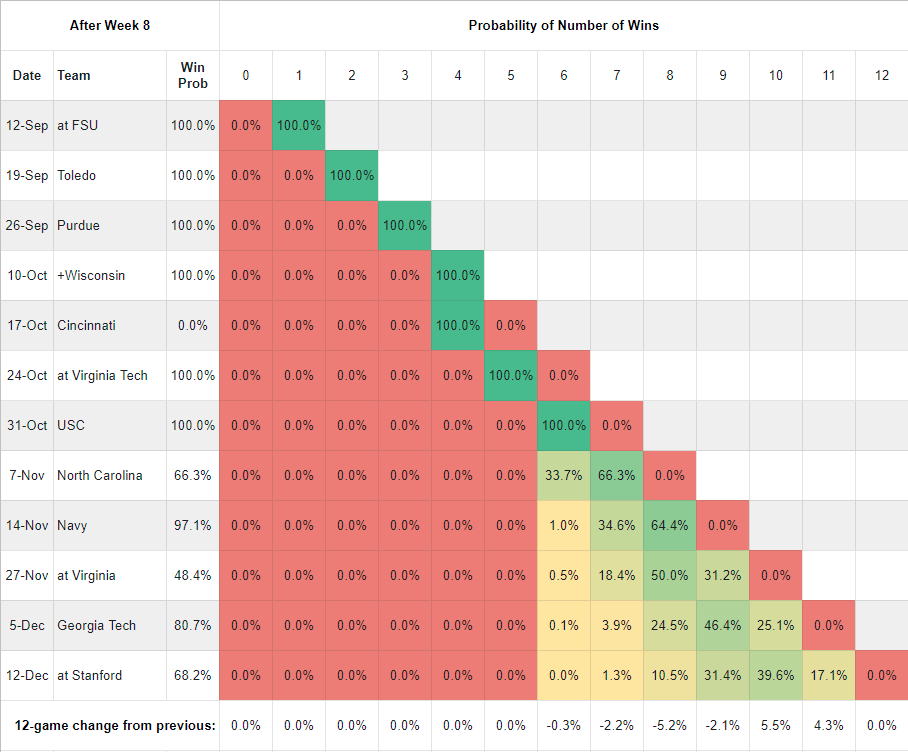
It’s a similar situation in FPI, where the third lowest win probability game of the second half is now behind us, only the bumps to 10-2 and 11-1 are a bit bigger because FPI thought that game was just fine, thank you very much. I’m still a bit confused as to why it thinks so highly of Virginia, who held off a furious fourth quarter rally from 3-4 Georgia Tech to win 48-40 this past week. The Cavaliers have allowed 6.5 yards per play to FBS competition this year. Their offense is probably legitimately good but their defense is terrible, which you would think would balance out. They have a decent road test this week at BYU, which will be very interesting to monitor.
Week by Week Game Trends
| SP+ |
|---|
|
| FPI |
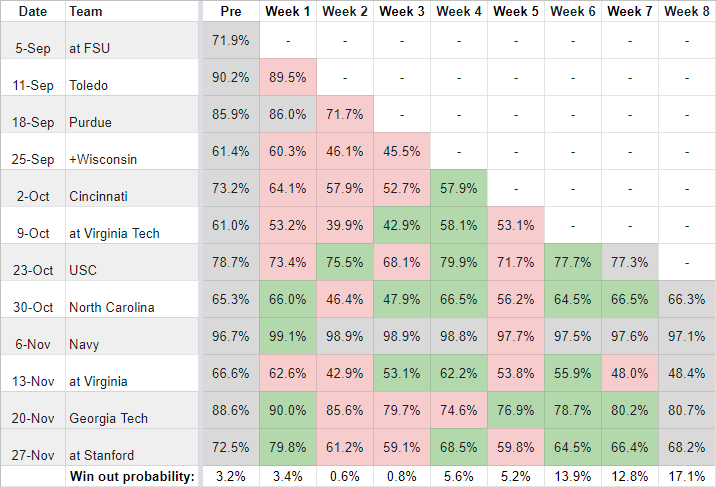 |
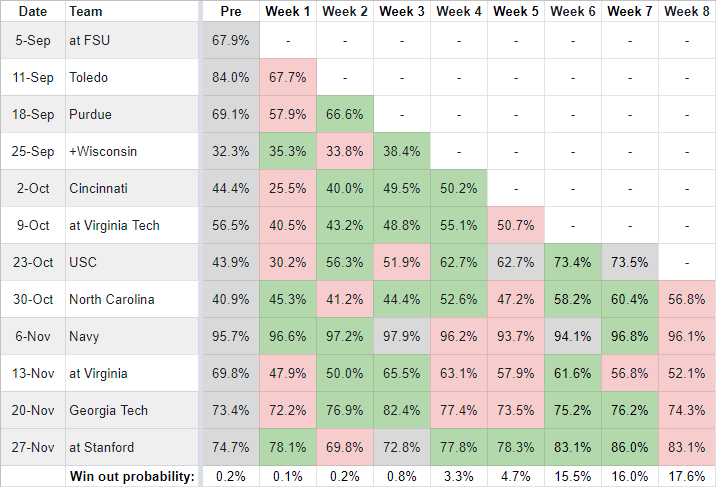
It wasn’t a huge shift, but the SP+ win probabilities did decline across the board due to the slip in raw rating. SP+ really, really likes North Carolina though, so an Irish win of any sort this week should come with a performance good enough to bounce back here. If you care about that… Meanwhile, as I mentioned at the top of the article, FPO remained basically unmoved. (That Week 8 Stanford box should be green, which I’ll fix for next week, but it doesn’t really change the point.)

I think that was true in the past, but according to this tweet preseason projections still account for about 40% of the overall ratings.
I wonder why that is the case.
I think it varies by team based on games played, but generally I think Bill + others have found that leaving preseason projections in longer than you’d expect improves his results. On a case-by-case basis it probably props up some teams like Clemson longer than it should in his ratings, but on the whole makes things more accurate since a long of those inputs (recruiting, last season’s production) are pretty sticky year to year.
Hmm – interesting. Would explain a lot about why Clemson and Wisconsin in particular have stayed so high for so along (and why it still likes UNC so much). I’m not sure I agree with him that there’s no way he could fix it without assuredly breaking more things elsewhere, but it’s his model. Mike’s point about “sticky” factors is well taken, but I would argue that Bill is overweighting the sticky factors.
Virginia’s QB is has the 4th best OVR grade for QBs according to PFF.
But the Defense is graded very poorly – and the worst grades are for their run defense. To give some context – USC’s run D is graded out at 66 – which is mediocre. VA’s run D is a 50! (Though they are apparently better tacklers than USC.) But overall VA’s D is worse than USC’s easily.
So one would expect we could put at least 38 on VA(assuming even on the turnovers).
Hopefully Hamilton will be back by then.
That’s ok, lots of people drink the Mack Brown kool aid too.