Checking out the advanced stats from Notre Dame at North Carolina: a dominant defensive performance, solid job by Ian Book as game manager, and a look at what’s ailing the wide receivers.
The Basics

This wasn’t a particularly pretty win, but thanks to a dominant defensive effort it never felt like an Irish victory was in doubt. In fact, by percentile performance, this was Notre Dame’s 3rd best game this season (trailing Temple and Miami), and a top-10 performance of the week according to the smart folks at Massey-Peabody. While the game felt very messy and trash-like for a long time, garbage time comprised only 11% of plays, beginning when Deon McIntosh scored with around 9 minutes remaining to put Notre Dame up by 23.
Explosiveness

With a lot of eyes on him, Ian Book was perfectly serviceable on Saturday. A minority of fans seemed to be hoping for a display of passing accuracy that would cause a QB competition, or perhaps a timeshare on obvious passing down. That didn’t materialize, as Book’s passer rating and yards per attempt (a paltry 4.7) were the second lowest of the season for the Irish (trailing only Wimbush at BC). Still, Book showed some nice flashes in his first start, and didn’t lose the game against an inferior opponent, which was really all Notre Dame needed.
Unsurprisingly the Irish were a bit less explosive than usual against the Heels, with the exception of a mandatory long Josh Adams touchdown. Remember when he was caught from behind after breaking tackles at Boston College a couple of times and fans fretted about “lack of breakaway speed”? Me neither. This was another vintage offensive line performance, as a combination of Adams early and McIntosh late piled up yardage in chunks.
North Carolina was able to find some random semi-explosive plays, but they seemed like pin-pricks against the Irish defense. The Heels manufactured a 25-yards touchdown on the eighth edition of “Irish corner in great coverage but receiver comes down with it anyway”, which is my least favorite weekly series, but that was the longest play of the day for the home team. Notre Dame has allowed only two plays of over 40 yards this year through six games (T6th nationally), and one was a dumb QB sneak. Last season in four games Brian Van Gorder’s defense had allowed five 40+ yard plays – let us every day count our Elko blessings.
My greedy “a million dollars isn’t cool. You know what’s cool? A billion dollars” wish for the defense was to increase their dominance against bad opponents. Limiting efficiency is great, but a stout underlying YPP and more havoc seem like the next steps for the defense to continue to improve. And Notre Dame was two for two in Chapel Hill, holding a bad Carolina offense to around 3.5 yards per play and forcing a number of turnovers and plays for a loss. The Irish are now up to #14 in Defensive S&P+ for the season, which is better than every opponent on the schedule minus UGA (4th). It’s the best kind of weird in 2017 watching a balanced team where it’s a legitimate debate if the offense or defense is a better unit so far.
Points per Drive Off & Def
(min 4 FBS opp, so ignore GT) pic.twitter.com/qTXM2yMWW5— The Solid Verbal (@SolidVerbal) October 9, 2017
Efficiency

Keeping the good feelings going, the defense opened this game by just smothering the undermanned UNC offense. The Heels offense had just one successful play in their first fifteen, and started the game with five straight three and outs followed by a turnover. Elko’s defense isn’t allowing opponents to break big plays, and they aren’t letting anyone to be very efficient either. No opponent has cracked a 45% success rate before garbage time, and only Temple and Michigan State managed one over 40%, which is the average national success rate.
A fun list:
National Leaders, Opponent Success Rate
- Michigan (26.0%)
- South Florida (26.9%)
- Clemson (29.2%)
- Northern Illinois (30.2%)
- Notre Dame (30.8%)
- Georgia, (30.9%)
….
- Alabama (34.2%)
That’s without any kind of opponent adjustments (yet), but you can only perform against who you’ve played, and that’s fantastic improvement for an Irish defense that allowed an opponent success rate of 43% (71st in FBS) last season.

Offensively, this was Notre Dame’s second worst game by efficiency, trailing only UGA. There were a few bright spots, however – the Irish were stuffed just four times in 44 non-garbage rushing attempts. After some questionable play calls resulted in two straight failures in power-run situations in the first quarter, the ND offense converted their next four in a row. The offense is currently top-20 in both power success rate (converting over 80% of runs on 3rd/4th and less than two to gain) and stuff rate allowed (15.1%). These are strong underlying factors that if continued should lead to an uptick in overall rushing efficiency, where the Irish are #45 nationally and should be better.
While it’s impossible to separate receiver performance from passing accuracy, wide receiver performance continues to be a concern. Midway through the season the Irish have been successful on only 34% of pass attempts (113th in FBS), and no receiver has a strong profile between efficiency, explosiveness, and production.
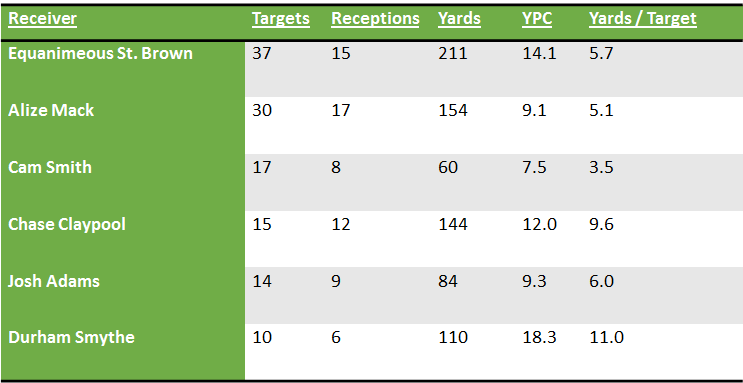
Last season Equanimeous St. Brown was both an explosive (16.6 YPC) and efficient (56.8% success rate, 65.9% catch rate). The explosiveness is still mostly there at 14.1 YPC, but St. Brown has only caught 15 of his 37 targets, and 5.7 yards per target is not good. Last season Notre Dame’s top three receivers – St. Brown, Torii Hunter Jr., and Kevin Stepherson – all averaged over 8.5 yards per target. Stepherson’s reintegration seemed like the best hope for the receivers to take a step up as a position group, but he’s hardly been a factor since his reinstatement.
Claypool stands out on the chart above – he’s been the most efficient and decently explosive of the wide receivers in limited playing time, and should continue to get more opportunities. Mack has been inconsistent and didn’t pile up huge yardage on Saturday, but did move the chains with successes on five of his six receptions. Quietly Durham Smythe is having an excellent all-around year, although he hasn’t been a consistent weapon in the passing game. But wide receivers, along with quarterback, seem to have the most control over whether this turns into an eight or double-digit win team in a tough second half.
Finishing Scoring Opportunities

All good things must eventually come to an end, and the ESPN graphics department curse (Notre Dame has scored on 100% of trips!) reared its ugly head. Fortunately for the Irish, this wasn’t a game where they needed to excel in the red zone and convert scoring opportunities to win. More than a real weakness, this performance will be cosmetically damaging to Notre Dame’s quest to finish top-10 in red zone or converting scoring opportunities performance.
Defensively, the Irish continue to play better the further they are backed up. The only area of concern is pass defense as opponents enter the red zone or close – seven of the eight non-garbage time touchdowns allowed by the defense have come through the air. All of them have looked pretty similar on tape – an Irish defensive back is in good position, but the receiver makes a better play on the ball (in some cases, like against UGA, an almost super-human play) and grabs the touchdown.
I won’t spend many words on Book’s interceptions – one was a bad decision, the other a miscommunication and errant throw. Again, better to have these miscues come in a game the Irish won handily than a close contest, and hopefully good learning material for a young quarterback. Defensively, the transformation of the unit into a group that has consistently taken the ball away while maintaining solid tackling and fundamentals has been a joy to watch. I spent some of the time after the game wondering about how Drue Tranquill fits in today’s NFL game and wondering where he could be drafted, which isn’t a sentence I expected to type a year ago.
The Irish won the field position battle in this one on the strength of the defense and a perfect Tyler Newsome punt. A 23-yard return by Chris Finke was nice as well, and the slippery fox increased his punt return yardage by 2,200% in this game.
On to cheeseburgers
No preview this week as we enter the bye – next week in lieu of an advanced stats review I’ll preview the upcoming showdown with USC. If you have any questions, topics, or requests for some type of advanced stats look at the season so far or second half of the year, let me know in the comments and I’ll take a look.



Great article!
It would be interesting to see compare our advance stats rankings with the 2nd half schedule ranked teams. According to the advanced stats are we favored? Are those teams genuinely strong? And (this may be too much) what are the chances those teams win out giving us a strong SOS?
I looked briefly and it didn’t seem crazy to finish with 5(!) teams with 10 wins or more on our schedule and even a couple with 9.
TT = tough tests left on their schedule; CR = current record
MSU – 10-2/9-3 at least TT = OSU/Penn st.; CR = 4-1
USC – 10-2 TT = ND; CR = 5-1
Navy – 11-1 TT = UCF, ND, Houston?; CR = 5-0
NC st. – 9-3 TT= ND, Clemson; CR = 5-1
Miami – 10-2 even 11-1 TT = ND, VT, GT?; CR = 4-0
n.b. Stanford 7-5 TT = WSU, WASH, ND; CR = 4-2
This is all to say that IF we win out, and our opponents play well the rest of the season (and admittedly this is close to the best case scenario) we could have close to 5 top 25 wins. That might be enough to get a 1 loss team into the playoffs. A lot of IF’s here no doubt, but it’s possible. And i think this is what would have to happen in order to overcome the one (however good) loss.
Good question, and it’s doable to look at all of those things for 2nd half opponents.
Enough to get in the playoffs is a big question dependent on a lot of things – I think odds are that any 0 or 1-loss P5 conference champ is in. So it depends first on how many of those there are, then to the comparison stage in terms of wins.
What about a look at who we have left that we match up well against statistically, or don’t. Our remaining opponents are generally strong – but can we look at the matchups more in light of strengths vs. weaknesses? Eg. If an opponent is weak against the run (a weakness we could easily exploit) it likely wouldn’t be as hard of a matchup for us as a team that is strong in that regard.
PS. Always love all the advanced stats work!
What are our projected wins based on today’s S&P for future opponents? I was checking the overall S&P rankings and I think everyone we face is 34 or higher except Navy (50 something), and who cares what their ranking is, they scare me based on the last decade. Miami out ranks us as of today as well.
https://www.footballstudyhall.com/pages/2017-notre-dame-advanced-statistical-profile
TLDR: ND goes 10-2 with the second loss @Miami
Not to “well actually” you TLDR, but that’s true of the individual games – S&P+ has us favored in all except the trip to Miami. But a lot of those games are projected to be close (58% win probability for USC, 72% for NC State which seems high, and 51% for at Stanford).
So while it predicts us to be favored in each of those games, the overall projected wins factors in that even while favored in all those games the likelihood of winning all of them is pretty low, so right now the projected win total is basically 9-3 (8.80 rounding up). I’ll expand on this a little next week (and the numbers will slightly change with more data) but S&P+ currently gives us a 5% probability at 11-1, 22% probability at 10-2, 34% probability of 9-3 (most likely), 26% probability of 8-4, and a 12% probability of 7-5 or worse.
Thanks, guys! I knew that we were favored, but couldn’t find the page with the win probabilities.
Yup, i get that, but i figured any good TLDR should be oversimplified 😛
Question on one of the numbers.
UNC has 1 Inside RZ, but scored 1.5 RZ PPD? Is the denominator not Inside RZ for this?
Also, I wonder how often teams have a better PPD Inside 40 than RZ PPD. Does anyone know? I would expect RZ PPD to be generally higher, but wouldn’t be surprised either way.
Ah good catch – should be 2 red zone opportunities, not one. They made it in on the 2nd quarter drive ended with the Surratt fumble (0 points) and in the 4th when settling for a field goal. So 1.5 RZ PPD is right, just didn’t update the trip to 2 on that last drive for them.
RZ PPD should be usually be higher – your expected points scored is much higher in a pretty linear way as you move down the field, and you’ll have more opportunities to play yourself out of FG range and punt the further out you go.
On average (across all teams) Points per Scoring opportunity is 4.27 points per drive, while red zone PPD is 4.94.
This might be closer than you’d expect, but it’s also not apples to apples. Finishing scoring opportunities counts long scores as well, so if a team is at midfield and scores on a 50-yard run, that counts and I think that boosts the average a fair amount. Bill Connelly’s intent there I believe is to capture the ability to score on explosive plays – if you can do that even a little consistently outside the 40, your performance inside matters less. And since those are rare in general, expanding the area of focus from the 20 to the 40 had a better correlation with team success – red zone year to year is much more random. Inside the 40 you should generally score most of the time, and it then captures if you’re settling for field goals (a losing strategy) or worse because of turnovers where it hurts the most or special teams play.
Scores outside the 40 are rare? Josh Adams laughs at you….hahahaha…but then gets tackled from behind by BC after 60 yds and Wimbush scores the TD.
How do the advanced stats stack up our first half opponents compared to the second half ones? Exactly how much harder is the second half schedule?