Notre Dame hung on to a massive first-half advantage to defeat the Trojans in a three-point win in South Bend. Despite controlling the game, SP+ gave Notre Dame a 28% postgame win expectancy looking at the final box score – how did the Irish escape despite allowing a massive success rate on the ground, the passing game struggling to find its footing, and cashing in fewer points per scoring chance?
NOTRE DAME 30, USC 27
Gonna watch this game on the treadmill this afternoon, but before I do … what? How does anything here make sense? USC almost never falls behind schedule, doesn’t turn the ball over, makes more havoc plays, and loses? pic.twitter.com/83yqAQTIl8
— Bill Connelly (@ESPN_BillC) October 14, 2019
Something not clear? Check out this handy advanced stats glossary.
No garbage time again in this game, although the end of half possessions and kneel downs have been excluded from the play and possession numbers.
Explosiveness
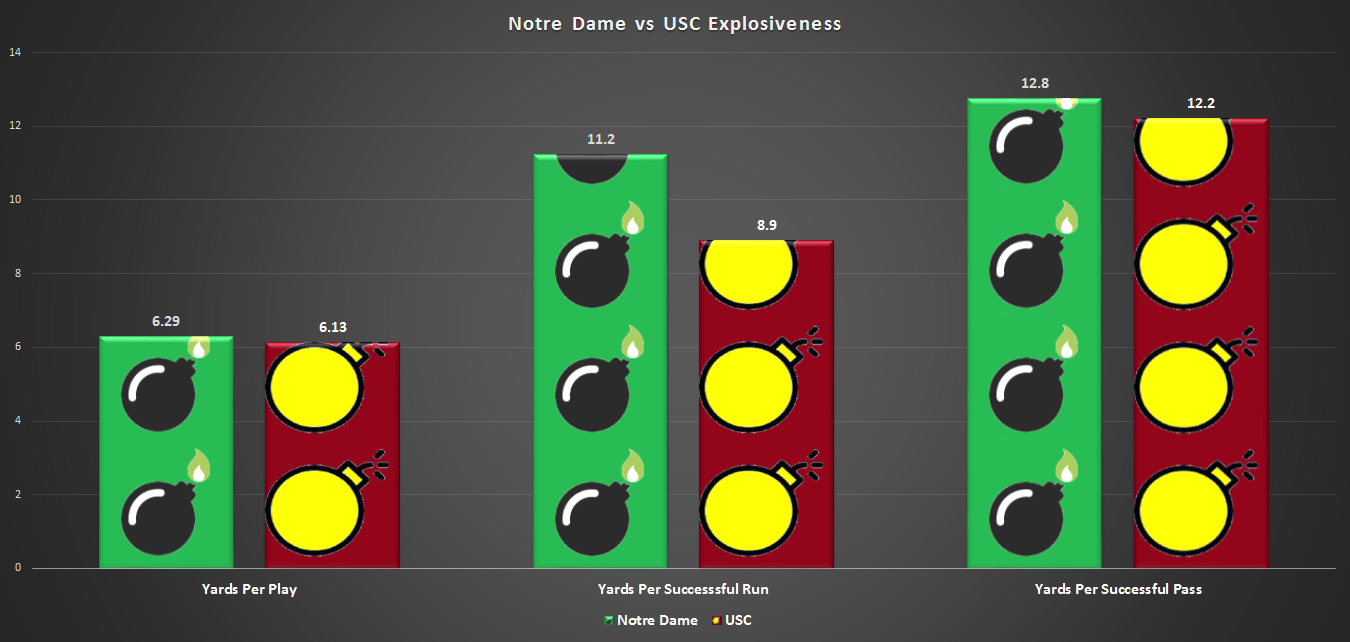
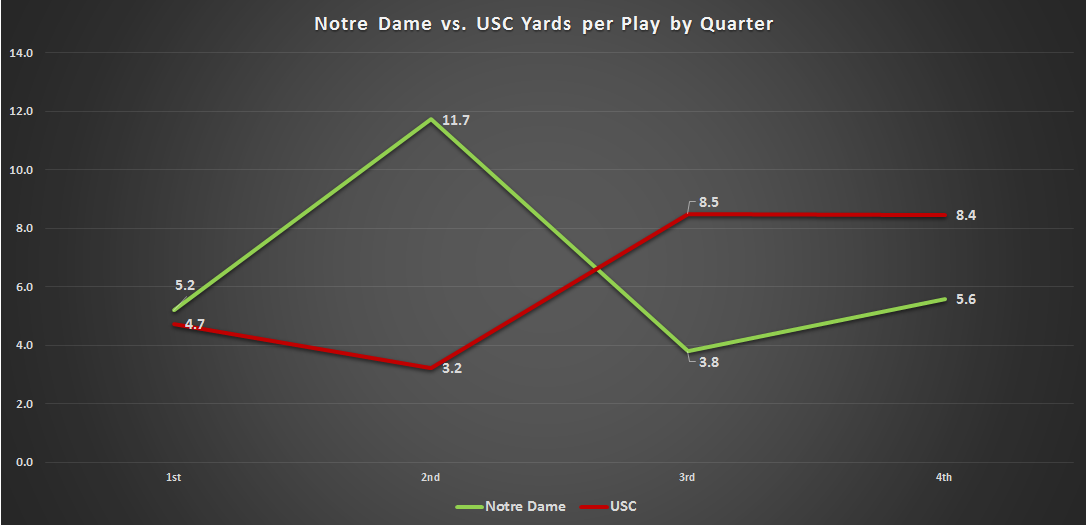
It took several twists and turns to get there, but when time expired the Trojans and Irish were virtually deadlocked in yards per play. SP+ postgame win expectancy is agnostic of game flow and play sequence. So simply analyzing the final stats, it sees a near-draw in explosiveness, and solid advantages for USC in efficiency, points per scoring chance, and average starting field position.
The Irish created a decent advantage in run explosiveness, fueled by Braden Lenzy’s 51-yard score (the longest play of the game) and Tony Jones Jr.’s 43-yard romp (the second-longest). Neither team was able to consistently generate big plays through the air, which seemed like a prerequisite for USC staying close, but the Trojans made up for it with their efficiency.
While the scheme has varied significantly week to week to achieve it, the Irish again executed bend but don’t break at a high level in the first half. Five of six USC first half drives ended at midfield or in Irish territory, and the Trojans had all of three points to show for it, with punts from the 50, ND 43, ND 42, and ND 42, to go along with a field goal. Notre Dame forced one three-and-out, but each of the other five drives gained between 28 and 32 yards (weirdly consistent!). Despite that progress, just one drive qualified as a scoring chance with a first down inside the opponent 40-yard line.
Don’t look now, but Clark Lea’s defense is once again one of the nation’s best in preventing big plays. The Irish are one of just seven FBS teams that have not given up a gain of 50 yards or more. And despite facing a strong stable of running backs, Notre Dame has given up just one run of 20+ yards in their last three games against P5 competition (UGA, Virginia, and USC).
Now, back to the twists and turns. Notre Dame out-gained SC by +4.28 yards per play in the first half, a margin that for a game would predict something like a 30+ point victory. The roles then flipped in the second half, as the Irish went up 20-3 and went into more of a ball-control mode, running on 68% of second-half plays.
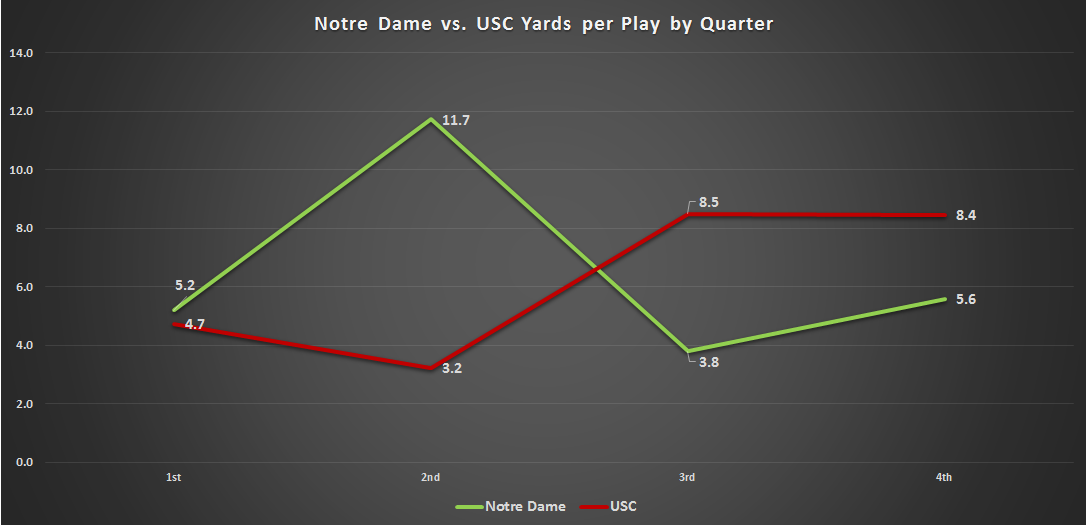
Again, this is the primary reason SP+ was confused by the game (and similarly the Michigan win last season). When a team goes up early – especially if fueled by factors like turnovers, converting scoring chances, or penalties, which are seen as less dependable – SP+ doesn’t account for strategic shifts as one team tries to milk clock and potentially eases up defensively.
Efficiency
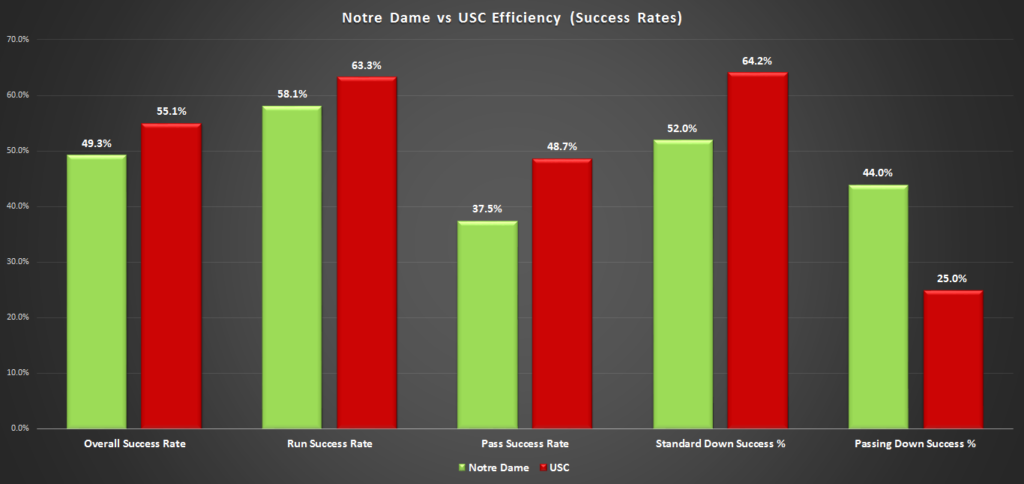
The bend but don’t break worked tremendously for the first 35 minutes of the game, as the Irish dared USC to beat them with long sustained drives and running the ball. Down Shaun Crawford and against one of the most talented receiving groups in the nation, Lea’s defense wanted to force USC to play mistake-free and string together long drives to score. Strategically, it made tons of sense – USC had been one of the most penalized teams in the nation and turned the ball over frequently.
In the first half, the USC offense didn’t shoot themselves in the foot but couldn’t convert when behind the chains, converting 0% of their passing downs. The Trojan offense had a 50% run success rate and 5.75 yards per carry in the first half but didn’t stick with the ground game. In the second half that number jumped to 78.6% run success and 7.29 yards per carry as Harrell and Helton started to make the Irish pay for their 3-down fronts and dedication to preventing deep passes over the top. Kedon Slovis played a clean game and eventually figured out that the tight end and Amon Ra St. Brown in the slot were the right places to look. Unfortunately for the freshman and his head coach on the hot seat, it was still too little too late.
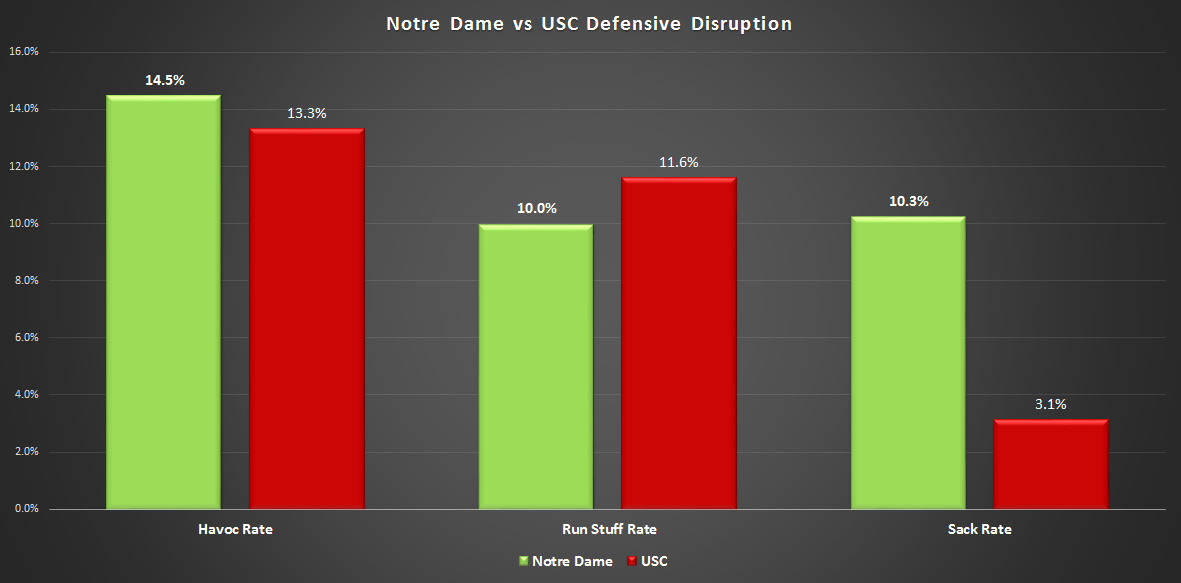
Notre Dame’s offense didn’t just break the two longest plays of the game on the ground, it also had its most efficient rushing performance of the season at a critical time. The Irish exploited the edges of the SC defense, a weakness that’s been consistent for the Trojans, but also was the first team able to run effectively up the gut of Clancy Pendergast’s defense. Jones Jr. was tremendous, successful on 60% of his carries, and the Irish were 4 of 4 in power run situations (3rd and 2nd or fewer).
Somehow in just four weeks, the ND offense has transitioned from not even attempting in earnest to run the ball in Athens to relying on a ground game more effective and explosive than the pass in a key rivalry game. The rushing attack was more efficient than passing for Notre Dame and also gained more yards per play on average, 7.16 yards per rush to 5.13 yards per pass play.
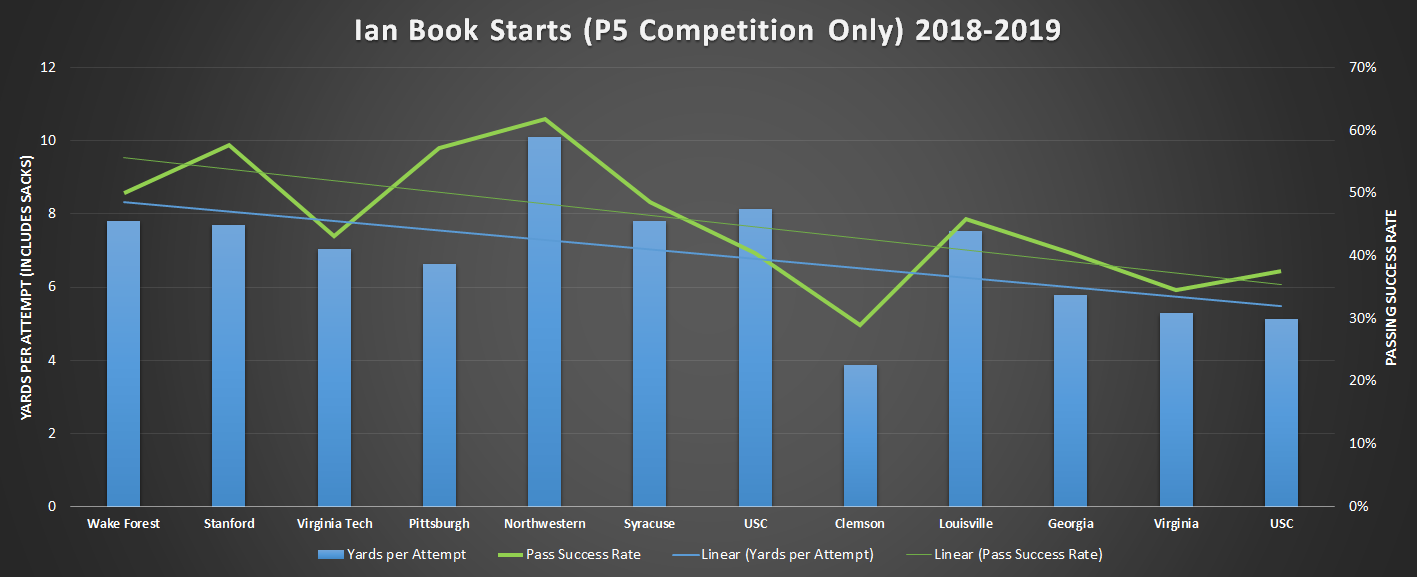
Granted, it has been a tougher stretch of defenses, but Ian Book has now posted three of his worst games in both yards per pass attempt and passing success rate in his last four starts. If you look at his 14 regular-season starts since taking over Wimbush (removing the playoff game versus Clemson), these three last games against P5 opponents represent his 12th, 13th, and 14th best performances in YPA and pass efficiency.
The Ian Book regression debate is very tiring already at midseason, but unfortunately extremely relevant. The passing game has taken an obvious step back in both efficiency and explosiveness compared to 2018, a fact obscured a little by the week to week fluctuations in the quality of opposing defenses and Book shredding New Mexico and Bowling Green. If you look at yard per attempt and passing trend lines including these games, things look relatively stable!
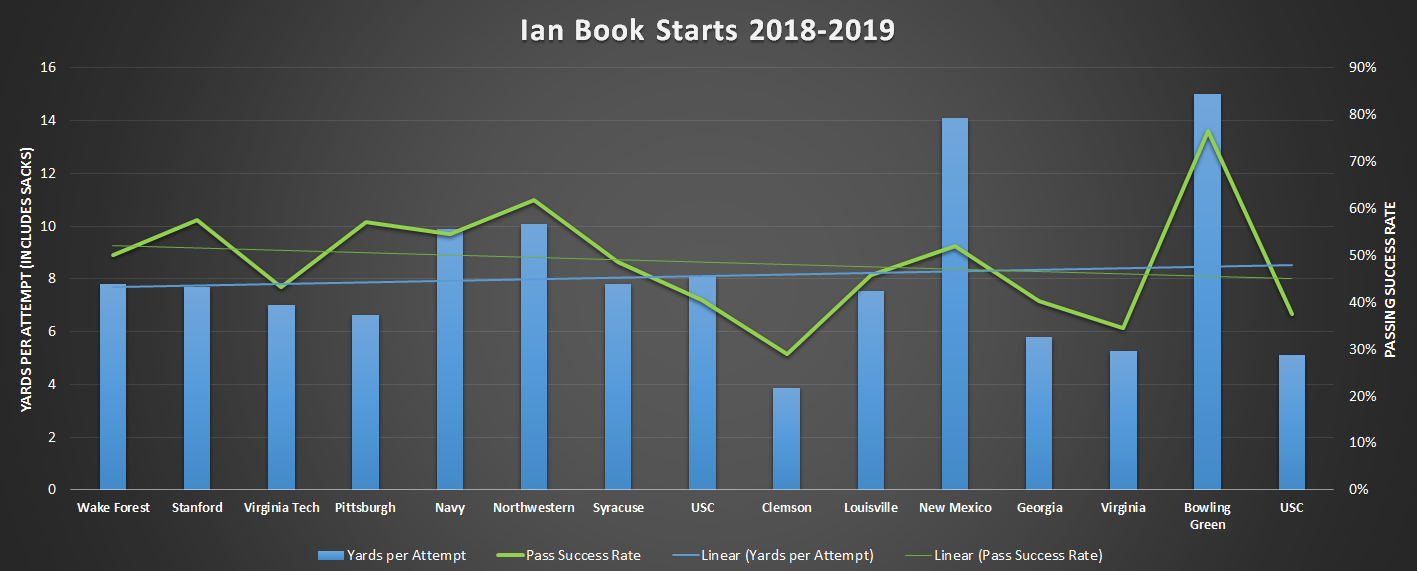
Take out the cupcakes this season (and for consistencies sake, Navy last year so it’s P5 competition only) and yikes now there’s a trend. This could be reversed, especially post-Michigan, but maybe it should represent a change in expectations for the passing attack under Book. Every regular-season start for Book in 2018 was remarkably consistent – yards per attempt between about 7-9 yards, and consistent above-average efficiency. Now in 2019, there’s been three performances with YPA less than 6, and two straight games with pass success rates below 40%.
If the passing game can’t stabilize, maybe the run game could be the savior? Last season there was a huge disparity between Notre Dame’s effectiveness running and passing in Book’s starts. The Irish gained 2.4 more yards per pass attempt, a pass success rate 11.5% higher than rushing, and a 2.5 times higher rate of explosive (20+ yard) gains. The run/pass splits were nearly 50/50 and I was a vocal proponent on leaning more heavily on the passing attack.
This season the run/pass ratio against P5 opponents is nearly identical (removing garbage time, 130 runs and 132 passes including sacks). But the script has flipped in 2019, with runs slightly out-gaining passes by 0.2 yards per play and with a success rate 11.4% higher. Explosive plays still favor the pass and it’s a relatively small sample size, but worth monitoring moving forward.
Finishing Drives, Field Position, & Turnovers
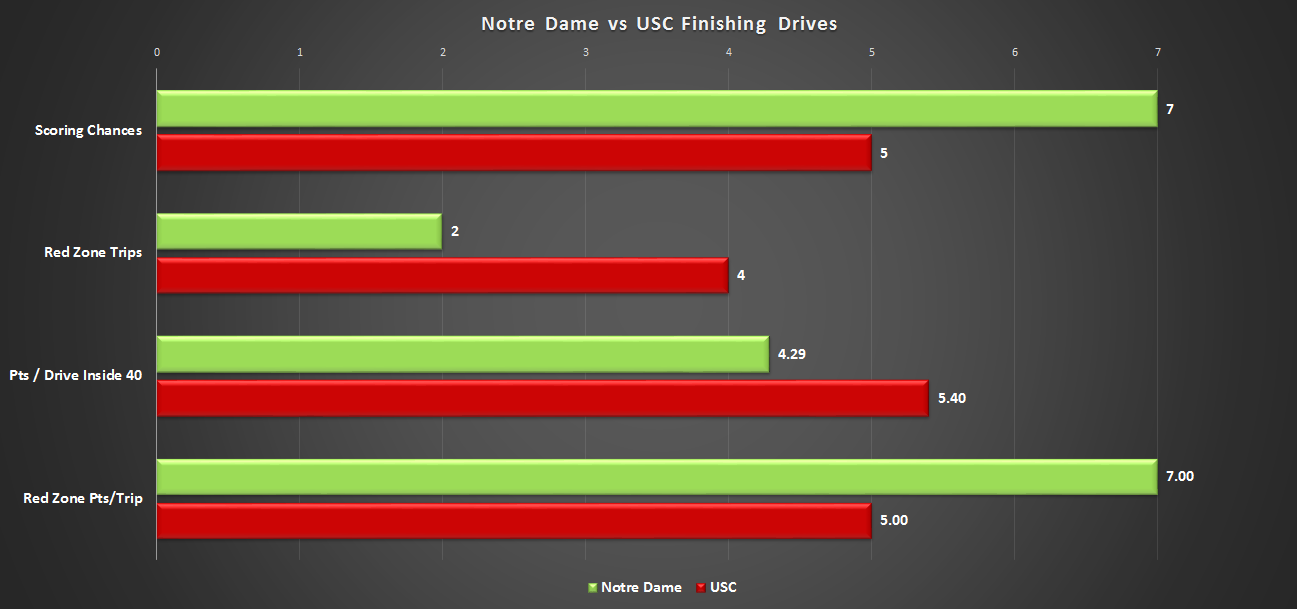
Notre Dame continues to dominate in the red zone, going a perfect two for two with touchdowns in both visits but stalling out on scoring chances that entered USC territory. The first Irish scoring opportunity of the game came up empty, as a first down at the SC 34 was derailed by a holding penalty and conservative play calling. Three other scoring chances ended in field goal attempts, fortunately with each still putting points on the scoreboard thanks to an incredible performance from Jonathan Doerer.
The defense finally broke late in the game with three touchdowns allowed on the Trojan’s final three drives, but holding USC to six points on the previous seven possessions made a massive difference building the lead. While the Irish offense didn’t step on Clay Helton’s throat, it came up clutch at key junctures to keep control of the game. When USC first narrowed the deficit to one possession, the offense responded with a field goal to push it back to a 10-point lead. The final touchdown drive was a thing of beauty as well, taking seven valuable minutes off the clock and still converting a touchdown after a brutal penalty pushed Notre Dame to 1st and 21 from the SC 41.
The field position battle finished with a slight edge to the Trojans (average start for USC from their 29, for Notre Dame from their 26) and wasn’t noteworthy. The Trojans got a small boost from a slightly better punting margin and the Irish failing on a 4th down attempt, while Notre Dame gets official credit for the onside kick recovery as its best “starting field position” of the day.
The absence of turnovers played into a boring field position battle, and there simply weren’t many chances for either team. Each ]had just one fumble each and recovered it, and there were just 6 pass break ups in 67 combined pass attempts between ND and USC. While this made turnover “luck” essentially even, it defied pre-game expectations as the Irish entered the game as one of the nation’s top teams in turnover margin and USC as one of the worst in the power five.
Does SP+ hate Notre Dame?
If you’re reading this, chances are you’re familiar with Bill Connelly’s SP+ system. It’s great, Bill is great, and historically it’s been my favorite source of advanced stats as there’s been more transparency into its inner workings and produced a greater wealth of metrics than any other college football rating system.
This year though, SP+ is relatively down on Notre Dame, ranking the Irish 19th after the bye week. This is behind teams like Michigan, Minnesota, and Missouri, and noticeably lower than other advanced rating systems – FEI has ND 11th overall, as does ESPN’s FPI. The Massey-Peabody composite, which takes a bunch of computer ratings (some you know like Sagarin and many you’ve never heard of) and averages things out, has Brian Kelly’s squad at 12th.
There’s a range of reasons for this, but the simplest explanation is that the Irish have yet to dominate a good team in 2019. Last season the Irish had strong yards per play advantages (at least two YPP advantage) against Wake Forest (4.17), Stanford (2.05), Virginia Tech (2.06), Northwestern (3.07) and Syracuse (3.28). This season, again excluding the thrashings of New Mexico and Bowling Green, the Irish haven’t had a yards per play advantage of more than 1.29 yards against Louisville.
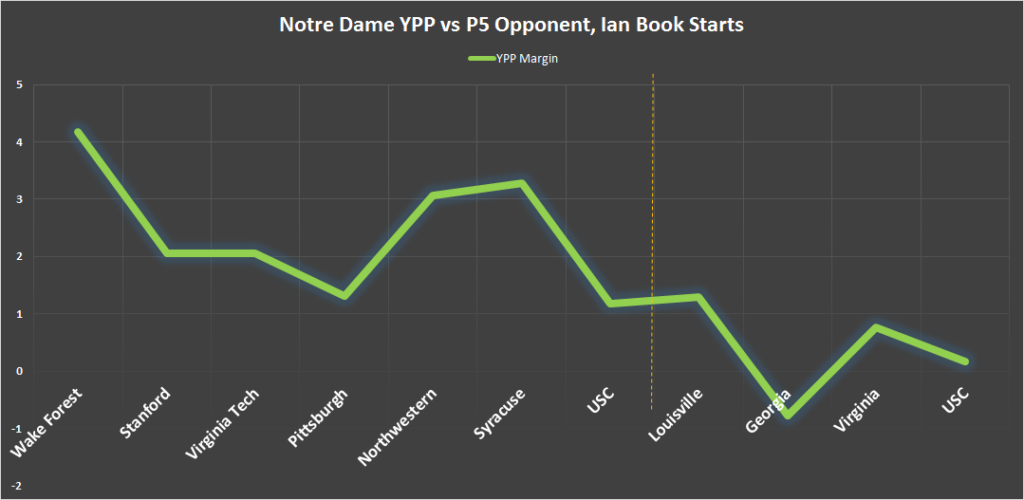
While earlier I highlighted the regression in the passing game, this drop-off is coming from both sides of the ball. The defense is giving up 1.22 yards per play more than this sample a season ago, while the offense is averaging 0.78 yards per play less. There are many reasons for this – you could argue this four-game P5 sample is much more difficult than any four regular-season games Book started last season. But this team is yet to combine all the potential it has shown in a single game – uniting the dominating defense from UVA and the rushing attack against USC with the passing attack that was able to move the ball pretty well against a strong UGA defense in Athens or that wore down opponents with its efficiency last season. Ideally, it all comes together this weekend in Ann Arbor.



I know you’re an advanced stats enthusiast Michael, and it’s interesting and I respect your writing.
On the other hand, it’s largely irrelevant to me that Book’s stats are down when he keeps winning. He made clutch plays with his arm and legs vs USC. Without those we lose. There were exactly 5 dropped passes hitting his stats that were perfectly catchable. I’m not counting his errant tosses, of which there were a few. His receiving corps is,as a unit, pretty average when compared to the likes of UGA, USC, and most likely Michigan. We’re perfect this year in the red zone. Not possible with a bad QB.
ALL the top qbs rated above him also play their share of cupcakes, in some cases an inordinate share. Nobody subtracts those stats from their overall record.
So, net net, I’m pretty satisfied with Book given the load he’s had on his shoulders with injuries and underperforming by some of his supporting cast.
And at, what, 14-2 as a starter, losing to last year’s champ and a top SEC contender this year, we’re doing quite well with him. Hopefully our team and coaches, not just Book, can perform and beat Michigan.
No one is saying Book is bad. And I didn’t even really look at his ranks compared to other QBs that have more talent. Simply pointing out that by traditional and advanced stats his performance is clearly trending the wrong direction compared to last season, which is the opposite of what we would hope for.
Can it be explained by tougher defenses, injuries, and maybe not great skill position talent? In part sure. But I don’t buy that out receivers are that much worse than last year, and Book’s accuracy and ability to move beyond his first read are noticeably off (Jamie of ISD articulates this extremely well on the Rakes Report podcast last week).
It could definitely get better and I’d anticipate improvement. The question is how much and how much Book could be limiting the ceiling. I’m not advocating at all for QB change, just taking a sober view of the pass game performance and what it is. Wins are great, but Wimbush was undefeated last year and yet clearly the offense had limitations and issues and if we hadn’t gone to Book we would have dropped a few games. Hand waving away the drop off because we keep winning would be like keeping Brian Van Gorder because we won 10 games in 2015 despite the defense underachieved, there’s more nuance than that.
Agreed, Michael. Waving off statistical trends feels like whistling past the graveyard, here. I want to hope that we can put it all together and play a great game on Saturday, but I could also see these statistical realities coming to bite us as the offense struggles to be effective against a good defense.
It’d be like not liking what SP+ is saying about us in a given year, and bringing in other data models that tell us what we want to hear instead. Luckily that would never happen.
Brandon Wimbush won a ton of games too.
Yeah, so I guess your point is we should decide playoff rankings by SP+, since it’s so great at predicting winners and the best teams. Last I saw, it’s slightly better than a coin toss over a full season of all games played.
Is SP+ like 60% for picking winners or for picking the spread?
Hey Michael, I have a serious question re FP+. I’m curious about how the advanced stats work.
I want to test an admittedly extreme and unrealistic scenario:
Let’s say ND wins every regular season game but always by 1 point.
Let’s also say every ND opponent wins all the rest of its games by 2-4 TDs.
Let’s further stipulate that none of our opponents play one another.
What would be the FP+ ranking? Would our FP+ be higher or lower than our opponents’?
How does it treat our squeakers vs their blowouts? Do our wins count for more or do their blowouts count for more?
Thanks for your advice. I’m guessing ND’s FP+ would be behind them??