Notre Dame dictated the game from start to finish, but USC was on par or better in efficiency and explosiveness. A massive early turnover (worth nearly 10 points in EPA, expected points added) set the tone, and the Irish dominated the Trojans in cashing in scoring chances to hold Southern Cal at arm’s length. The new-look ND offense had its most efficient passing game of 2021, and the defense prevented enough big plays to stall out Drake London and company.
Continuing the theme of 2021, there was no garbage time against USC and only end of game kneel-downs were excluded.
Confused? Check out this handy advanced stats glossary here or reach out in the comments.
A remix of 2019 – more impressive on tape than in the box score
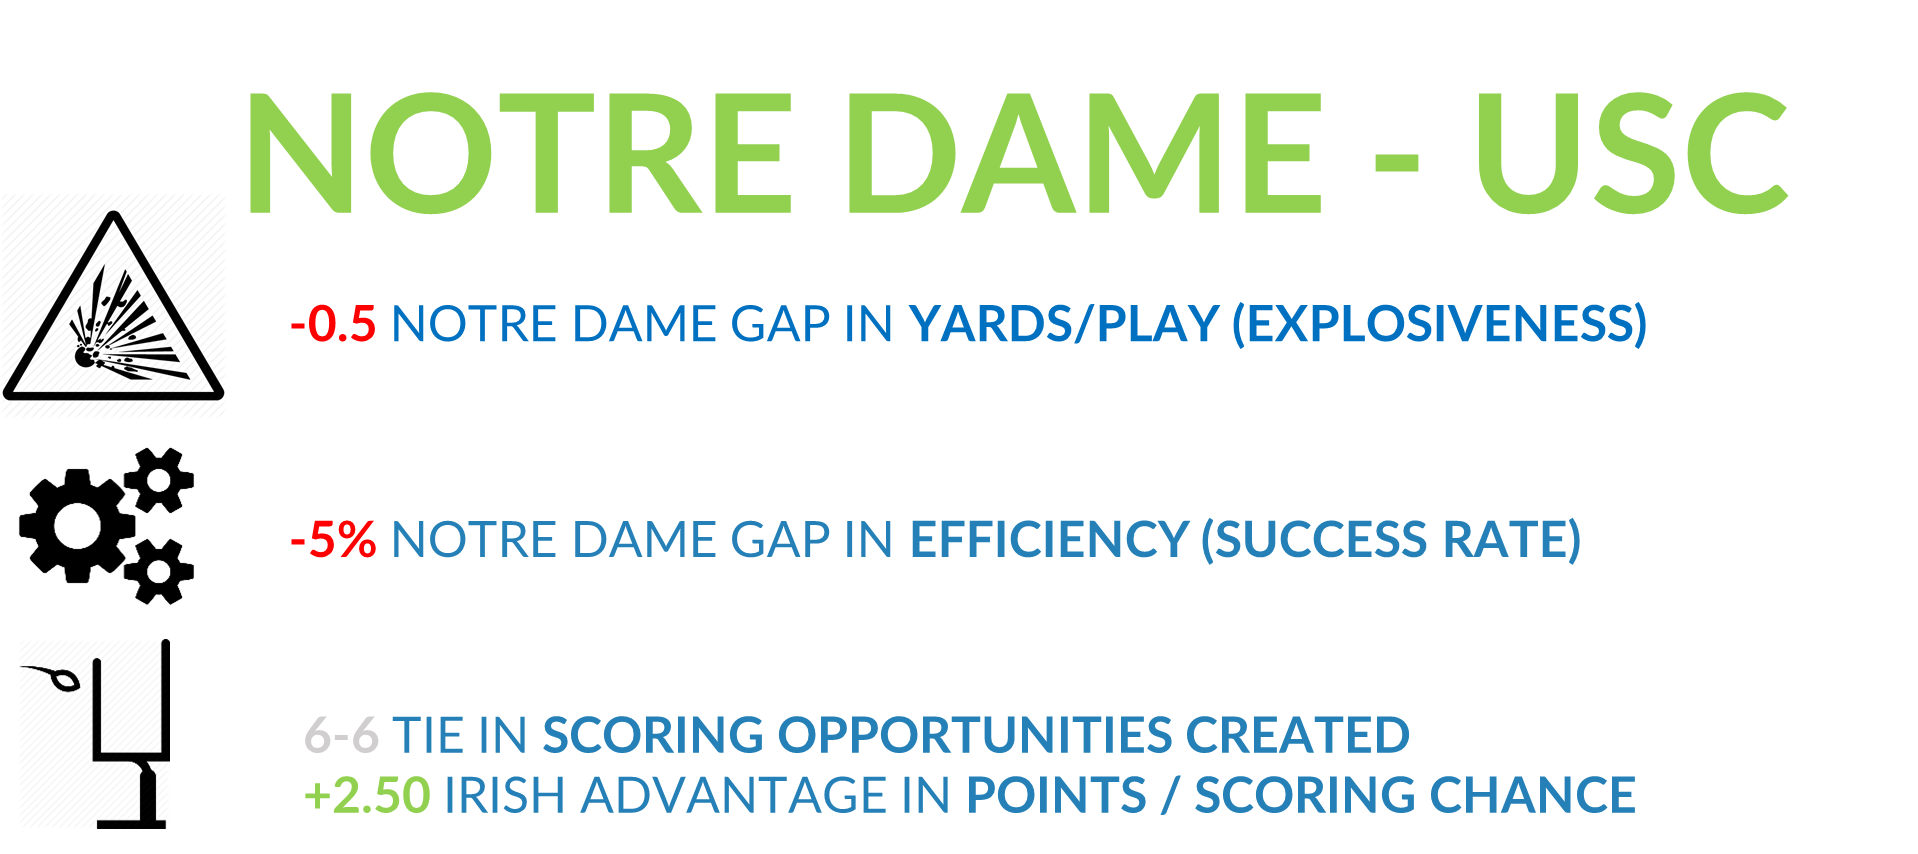
SP+ saw this game as a coinflip or slight edge to USC, which isn’t shocking when you view the final advanced stats. The Trojans were +0.5 in yards per play and while both teams were very efficient, SC had the edge in success rate by 5%. Both teams created the same number of scoring chances.
It was eerily reminiscent of 2019, where Notre Dame also built an early lead despite Graham Harrell’s offense moving the ball consistently. That game was also 17-3 at halftime, with USC advancing into ND territory five times in the first half but with just 3 points to show for it. Clay Helton’s team mounted a late comeback in that game but were held at arm’s reach by some timely Ian Book and Tony Jones-led drives.

Similar issues led to the Trojan’s downfall on Saturday. USC created scoring opportunities on four of their first five possessions, with two red zone visits. Those four drives averaged 10 plays and 58 yards gained, but netted just three points on the scoreboard. Marcus Freeman’s defense continued to come up clutch in key moments, with a strip sack (recovered by SC) and the Bo Bauer interception in the red zone. The timely stops included an assist the Trojans, who generously donated their final first-half possession as a case study for future clock management courses.
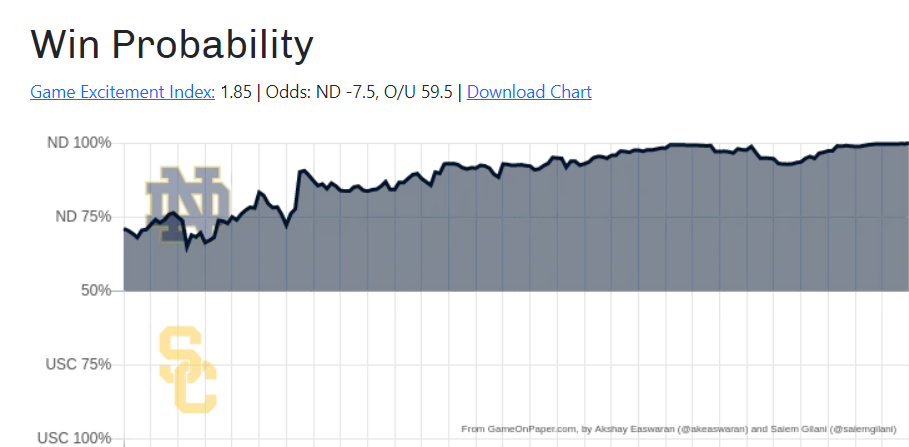
Both the 2019 and 2021 games had the Irish with <50% win probability in SP+, but this is where most advanced stats systems struggle – capturing the impact of game sequence and flow. The game never entered garbage time, but the Irish increasingly ran the ball on early downs and may have been more conservative on defense with at least a two-score lead for the vast majority of the game. Both teams moved the ball fairly easily – there were 12 scoring opportunities in just 17 total possessions – but Notre Dame was vastly better situationally.
Another new Irish offense emerges post-bye week

The wild ride that is the Notre Dame offense has now flashed a little bit of everything this season. Explosive through the air against FSU, hapless on the ground the vast majority of the first five games, unreliable finding consistent passing success for most of the season, and now debuting an efficient passing attack that appears like a nice Ian Book tribute. The 55% passing success rate was easily a season high, eclipsing the 50% mark against Toledo.
The rushing game was complementary, with above average efficiency and a workmanlike 4.74 yards per carry. Kyren Williams continues to do ridiculous things after contact; please appreciate every carry he has left with a gold helmet. One of the big turning points allowing the offense to sustain long drives against Virginia Tech and USC has been negative play preventation. After allowing a 25% stuff rate on runs through the first five games, the Irish were stuffed on just 5 of 77 runs (6.5%) against the Hokies and Trojans.
It was a great week for Notre Dame to find it’s quick and efficient passing attack, because USC was dropping successful plays left and right too. How were both teams so efficient? In part because both defenses struggled to create any disruption. For the Irish this was likely a result of dropping guys constantly against the Air Raid; for USC, it’s hopefully a sign of an improving Notre Dame line combined with a suspect Trojan defense.
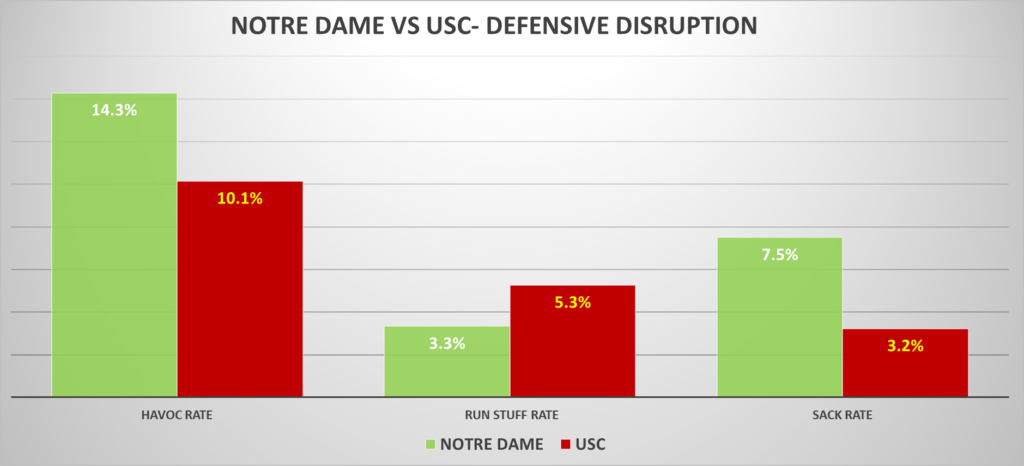
Both teams avoided passing downs, with extremely reasonable average 3rd down distances to gain (ND 5.6, USC 6.3). The Irish were able to gain a little more separation by converting these chances at a higher rate (ND 8/12, USC 6/13).
A draw in explosiveness worked out fine
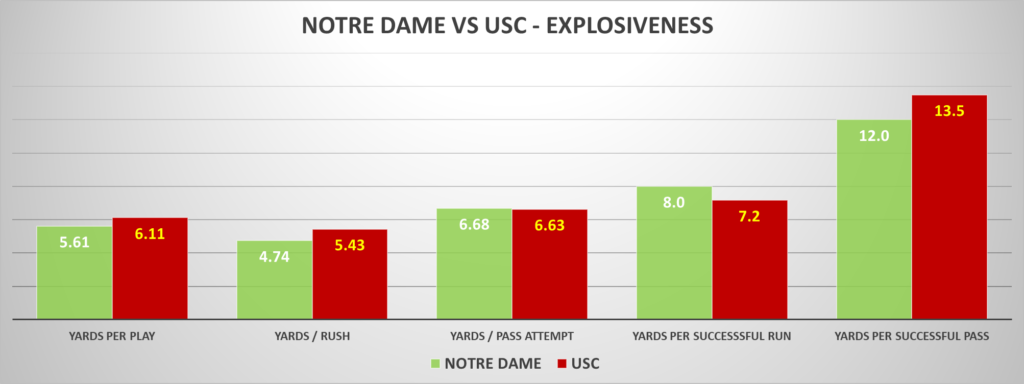
The Trojans edged Notre Dame in yards per play, and were slightly more explosive through the air thanks to Drake London’s 4th quarter catch that was the longest play of the night. But it was a win for the Irish passing game to equal Kedon Slovis and London in yards per passing attempt, and neither team was able to find room for many big plays. USC’s nine penalties for 65 yards also helped negate whatever small advantage they might have hoped to establish in the yards/play and efficiency battles. Incorporating penalties Notre Dame was actually +0.2 YPP.
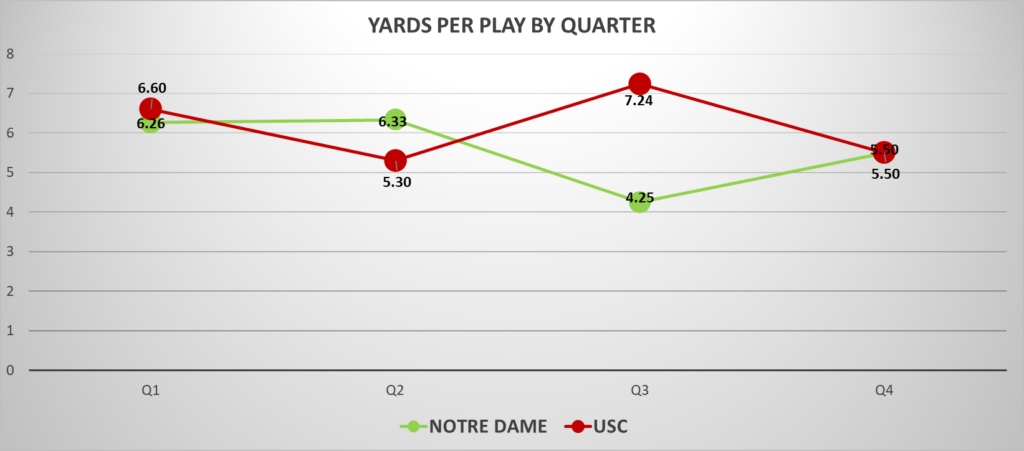
The splits of yards per play by quarter show in the inability of these teams to separate much on a per-play basis. But on a per-possession basis? The Irish were +2.1 in points per drive (ND 3.9, USC 1.8), and gained a much higher percentage of available yards (75% of available yards gained versus 59% for USC). That mark is an incredibly encouraging sign for the new-look Notre Dame offense – in the six previous games, Tommy Rees’s group hadn’t cracked gaining over 47% of available yards (previous high versus Toledo).




How dare you give me such hope and optimism!!!!
Kidding, love these write ups, also, love the new infographics too, especially the win probability one!
Things make a lot more sense when YPP includes penalties.Do the projection systems account for that? It’s not a surprise that USC lost the penalty battle based on their history.
Also I don’t feel super confident in our OLine still. It’s just Kyren is so ridiculous that he only needs a chance to turn something into positive yards. Interested in PFF grades for the line.
The difference is now Kyren is for the most part doing his ridiculous stuff at or past the LOS instead of behind it. The OL has definitely played markedly better the last two games. I’m not sold it will continue either until, well, it continues, but they’re definitely trending up.
I think it depends on the system. They aren’t counted in SP+ that I’m aware of, at least in the core categories. There could be a really small modifier applied if you are good / bad but if you zoom out guessing they are mostly random – a few teams consistently penalized or good at avoiding them, but maybe not very stable over the course of a season.
FEI definitely does capture the impact of penalties though, since it’s drive-based and those penalty yards are getting added or subtracted from the total drive, and it’s I think also directly capturing points per drive.
This is sort of mentioned, but in looking at ypp it shows a better reflection of the game if you break it out by run vs pass. Based on CBS’s box score, ND was +0.1 ypp in both rushing and passing compared to USC. We just ran a lot more, like you would expect with a 75% win probability. This brought overall ypp down because we did more of the inefficient, but more likely to make you win, thing.
A classic stats trick of the eye.
hmmm yes however you slice it very even across the board. my numbers have USC’s with more of an edge rushing since the CBS one is counting sacks as rushing attempts.
just looked at the splits for ND by half to show how much we took the foot off the gas:
1H: 12 runs on 29 early down plays (41%)
2H: 22 runs on 27 early down plays (78%)
Ugh. Why is anyone still counting sacks as rushing yards. So stupid. Why doesn’t some major network like CBS start counting them correctly, then everyone will just follow suit. No one cares about what the NCAA says is official anymore.