The third most important of the Five Factors is field position – will Notre Dame football’s average starting field position improve in 2016?
Background: For those unfamiliar, most numbers included come from Bill Connelly’s S&P+ and Brian Fremeau’s FEI statistics – glossary of S&P+ terms here, and more efficiency stats at bcftoys.com. As always, ask away in the comments on any questions as well.
2015 Stats:
Average Starting Field Position – Offense: 28.7 (97th nationally)
Average Starting Field Position – Defense: 26.6 (9th nationally)
Special Teams: 9th in Overall Special Teams Efficiency, 9th in Field Goal Efficiency, 26th in Punt Return Efficiency, 74th in Kick Return Efficiency, 16th in Punt Efficiency, 43rd in Kickoff Efficiency
Field Position is the most complicated of the Five Factors to untangle – special teams play a huge role, turnovers are critical, and it’s also dependent on the offense and defense. An offense gaining first downs can greatly help the defense’s average starting field position. Quick defensive stops can likewise give the offensive better starting field position.
Luckily, advanced stats guru Bill Connelly has broken this down in detail – check out this piece for all the nuts and bolts. After taking a deep dive through the data, this is what he found most closely correlated and predicted field position advantages:
Success Rate (37%)
Kick Margin (22%)
Punt Margin (22%)
Turnover Margin (21%)
To hazard a guess at whether or not the Irish will improve their performance in the field position battle, let’s look at each of these factors.
Success Rate
This essentially captures the contributions of the offense and the defense to field position. Does your offense regularly pick up first downs and yardage that then can put the defense in a better situation if you need to punt? Can the defense force three and outs and minimal yardage gained to help the offense start closer to the end zone?
Success Rate is the primary measure of efficiency, which was covered in last week’s post here. In short, I expect Notre Dame’s offense to remain extremely efficient, with the possibility within reach to become excellent by improving in some small areas like power run situations and decreasing the percentage of stuffed runs. On defense, it’s very dependent on how Brian Van Gorder approaches 2016. If he sticks to what he’s shown in the past, I’d expect similar defensive efficiency. But if limiting explosive plays is truly a priority, efficiency is the most likely trade-off.
If these changes add up to similar success rates, that’s a win for the Irish. Adjusting for opponents, Notre Dame was 4th in offensive efficiency and 33rd defensively, which contributed heavily to advantages in starting field position in 10 of 13 games in 2015 (all but Clemson, Pitt, and Ohio State).
Kick Margin
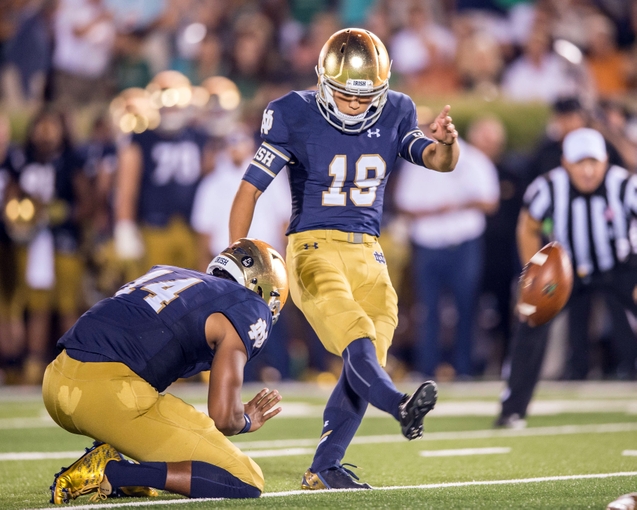
Quick aside- let’s jump in a time machine back to the late summer of 2015 – special teams were an enormous question mark! Two freshmen were taking over the kicking duties after Kyle Brindza’s departure. Greg Bryant had given the team a much-needed shot in the arm on punt returns, but then was suspended and transferred. Amir Carlisle never quite emerged as the returner the staff and Irish fans hoped he would become. When there are numerous message board threads questioning place-holding responsibilities, you know it’s bad. And then, leaning on freshmen in key roles, the Irish finished 9th in FEI’s special teams efficiency.
There’s just one aspect of Notre Dame’s special teams in 2015 that was sub-par – kickoffs. The Irish allowed 35.9% of kickoffs to be returned past the 25, which was 103rd best in FBS. To my amateur eye (calling all Punter Bro’s and other special teams enthusiasts!) it seemed like Notre Dame settled on a strategy of high, angled kickoffs. This resulted in a low touchback percentage (25%, 94th nationally), high number of kicks out of bounds (5, tied for 10th most in FBS), and average starting field position. I’d diagnose this as a shared opportunity for improvement; both kicking and the coverage unit should improve on these marks.
Notre Dame was fairly week returning kicks all season – some bad-decision making by returners played a part, as well as poor blocking. Assuming he fully recovers from a hip injury, CJ Sanders should provide a burst in the big picture- but he needs the team in front of him to give him better lanes to work with. In totality, this feels like an area where Notre Dame’s should be at parity or an advantage in 2016 where last year it was an overall disadvantage.
Verdict: Better
Punt Margin
Tyler Newsome showed off his leg-cannon during his first season, averaging 44.5 yards per punt (15th nationally). Where Newsome and the team can improve is in balancing distance, hang time, and coverage – the Irish ranked 48th in net punting. With another season under Newsome’s belt, I’d expect fewer touchbacks, punts that set up better coverage, and an improvement into the top-25.
On the return side, Notre Dame took a leap in punt returning excitement with CJ Sanders, who averaged 7.3 yards per return. The downside was inconsistency – a few long returns offset by a low total success rate (83rd nationally). Total speculation, but I’d expect his average to increase in 2016, with more (smart) fair catches to pair with the big returns.
Verdict: BETTER
Turnover Margin
Notre Dame’s defensive starting field position was actually helped by red zone turnovers. They were super costly in the grand scheme of things – it’s not all that much better than turning it over close to your own end zone when accounting for the expected points given up. All in all, it likely inflated Notre Dame’s opponent average starting field position a little bit. Since turnovers are the last of the 5 Factors, stay tuned for a full post coming up in a few weeks.
Sneak peak verdict: Better
Overall
The field position battle isn’t sexy – usually when it’s highlighted in a broadcast it means it’s a game that’s low-scoring, turnover-filled, or one-sided in special teams. It is however, extremely important – from Connelly’s data, even slightly more than turnovers (gasp!) and equally as important as finishing drives. Average a starting field position just 6-10 yards better than your opponent? Historically, you have 78.3% chance of winning.
So this is a sneaky area for potential improvement that could fly under the radar. It feels like one of the more likely areas for improvement for the 2016 Irish as well. Newsome, Yoon, and CJ Sanders should all be better in their second seasons. A more consistently efficient offense (or defense) could also pay dividends, and offensive turnovers (in theory) should decrease with a more veteran QB.

Great stuff Mike. The correlation to winning makes sense – you’re essentially forcing your opponent to use one more set of downs to score, which gives them a few more opportunities to screw it up along the way. I’d like to see us get much better on kick return blocking, which to my equally-untrained eye (we really need PunterBro to chime in here) seems to be, shall we say, hit or miss for the most part. I think punt returns for anyone are destined to be chaos, so you do what you can, but kick returns should be more organized.
Is PunterBro back? I enjoy his articles!
Looking forward to watching CJ Sanders. He seems like he has the talent and aggressiveness to excel returning from what we have seen in our relatively small sample. It’s been nice to watch the Special teams go from dumpster fire to pretty-ok/averagoodish
Yes, I truly believe he will be a . . .
Ray
. . . of hope for our Special Teams in 2016.
/drops mic
Can we still say “greened it” if it doesn’t turn green?
I think special teams is an area where we have ample room for improvements. If we can make gains here, that could be the difference from a 10 win season and more than 10 wins.
Of course, we still have to improve defensively if we want to make the playoffs.
Do it like this: