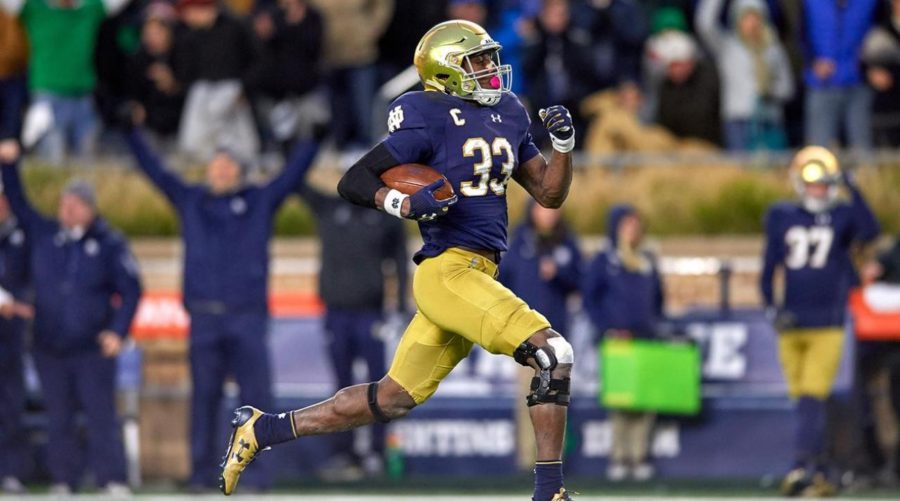
We may be witnessing, pound for pound, the greatest modern rushing attack in Notre Dame history during this 2017 season. Many who are reading this already know the Irish are 5th nationally in yards per game (324.7), 1st in yards per carry (7.04), 2nd in rushing touchdowns (34), in addition to being at the top or leading several rushing categories against ranked opponents and FBS teams with winning records.
Looking back through the archives it becomes brutally clear how different the game was played and how inefficient offense were relative to modern standards. For example, take the 1984 Notre Dame team that averaged 146 rushing yards per game at a paltry 3.2 yards per carry. That’s brutal. And there are a lot of seasons in the 60’s, 70’s, and 80’s like that, too.
Since 1960 there have been 3 Irish offenses that averaged over 300 yards per game on the ground. It’s a little difficult to compare eras and pull team stats but we can definitely say these 1968 (305/game, 4.6/rush), 1972 (304/game, 5.1/rush), and 1973 (350/game, 5.2/rush) Parseghian rushing attacks were among the best in the country for their time. These stats don’t reflect bowl games but even in the case of the 1973 famous Sugar Bowl against Alabama the Irish offense still ran for 257 yards on 59 carries, so their season averages were only marginally reduced after the 11th game.
Furthermore, those 3 Parseghian seasons are surrounded by much different running games. The 1971 team that preceded that great 2-year run averaged 231 yards per game and a far less imposing 3.7 yards per rush. The 1974 offense averaged 283 yards per game (still pretty awesome) and 4.6 yards per carry.
Interestingly, no Lou Holtz teams ever ran for 300 per game although they played some of the toughest schedules in school history by a large margin. The 1992 team was still mighty impressive (280/game, 6.0/rush) but what’s fascinating is that these rushing averages are probably the floor for this 2017 team if they stumble down the stretch.
With all this said, I was interested in the situational stats for this 2017 running game to see if there was anything helpful to explain how or why Notre Dame is so good this season.
Rushing by Quarter
Attempts—Percent Runs—Rush Average
1st Quarter
2017- 104 (64.1%) – 6.81
2016- 117 (57.9%) – 5.28
2015- 119 (56.1%) – 5.55
2nd Quarter
2017- 110 (54.1%) – 7.32
2016- 111 (48.6%) – 3.36
2015- 121 (50.2%) – 5.64
3rd Quarter
2017- 88 (61.9%) – 7.77
2016- 99 (53.2%) – 5.87
2015- 109 (58.2%) – 7.17
4th Quarter
2017- 113 (71.5%) – 6.42
2016- 109 (52.9%) – 3.53
2015- 131 (58.4%) – 4.41
I’ve used the last 3 seasons for comparison both because they include at least one bad season and one good season and the 2015-16 Kizer offense utilized the quarterback’s wheels to a similar degree in terms of carries.
Obviously, the 2016 team lost a lot of games even if many were close so we’d expect the rushing splits to be quite a bit lower. What’s interesting is that the ’16 team tried to run the ball to open games relative to Kelly’s past but things kind of fell apart thereafter.
The 2nd quarter has always been Kelly’s most aggressive quarter and we have another data point with 2017, as well.
We wouldn’t expect the 2016 team to be running the ball that much in the second half, and while the 2015 team had pretty steady averages outside of the 2nd quarter, they weren’t leading games by enough to substantially sit on leads and run more often late in games.
The 1st quarter rushing percent is as big of a stat as any that shows Notre Dame is committed to running more than ever.
Rushing on 1st Down
2017- 192 (63.5%) – 6.87
2016- 213 (57.8%) – 4.00
2015- 247 (60.8%) – 5.11
A 2.7% increase from 2015 to 2017 feels about right to me because the offense continues to work Wimbush’s arm early and often while staying committed to the run (see last week where a pair of passes on the opening drive cause a small revolution). Even with the total increase in rushing this isn’t the type of offense that is going to come out and methodically run the ball on 1st down 80% of the time.
Red Zone Rushing
2017- 75 (72.8%)
2016- 75 (54.7%)
2015- 79 (58.9%)
I’ve dropped the rushing averages from here on out because they don’t offer much insight. In the red zone it’s difficult to ignore the relationship between an enormous increase in running the ball for 2017 and the offenses current elite touchdown percentage.
However, the production and threat of Brandon Wimbush in the red zone simply cannot be overstated. Out of his 19 red zone carries he’s scored touchdowns 11 times and picked up a first down on 4 other attempts. His other 4 carries included a pair of stuffs (gains of 0 and 1 yard), an 8-yard carry on 3 & 9, and a 10-yard carry on 2 & 11.
A success rate of 84.2% from the QB running the ball is absurd. It’s flat out ridiculous in the red zone.
Kizer was pretty good in the red zone back in 2015 but struggled far more last season. In total for 2015-16 he carried the ball 65 times with 16 touchdowns and an additional 13 first downs.
Rushing When Winning by 15+ Points
2017- 182 (67.4%)
2016- 82 (57.7%)
2015- 94 (75.8%)
A few things jump out here. One, the 2016 team was so messed up that they didn’t run the ball appreciably more in situations in which everyone outside of Pullman run the ball a great deal more than usual.
Two, the 2017 team hasn’t run a ton which is partly explained by allowing Wimbush to get some reps with his arm when games are well within hand.
Three, this current offense has been snapping the ball with a big lead so damn much. Funny enough, the 2016 team actually had a 15+ point lead on 17.1% of snaps and the 2015 team, despite making it to the Fiesta Bowl, only in 14.3% of snaps.
The 2017 offense has been leading by 15+ points on 40.6% of snaps!
Rushing When Winning by 8-14 Points
2017- 57 (63.3%)
2016- 43 (48.8%)
2015- 89 (53.2%)
Here we have a level of comfort running the ball in 2017 previously unseen.
Rushing When Winning by 1-7 Points
2017- 76 (57.5%)
2016- 65 (59.0%)
2015- 102 (54.5%)
Rushing When Tied
2017- 56 (57.1%)
2016- 104 (55.6%)
2015- 76 (54.6%)
Rushing When Losing by 1-7 Points
2017- 44 (58.6%)
2016- 107 (52.7%)
2015- 62 (52.1%)
For the last 3 situational splits things aren’t too different among the 3 seasons. I don’t think there’s anything too unusual with this, though. When games are close the rushing attempts come down quite a bit. The only thing worth note is that there’s a level of patience while losing by 7 points or fewer (the Irish haven’t trailed by more all season) with 2017 than we’ve ever seen.
So, are the Irish running to win this year or is it winning to run? It’s probably a bit of both! I was wrong during the pre-season I thought the Irish would run the ball 57% to 59% of the time IF the team was really good. Turns out, they’re even better than most thought and they’re now running the ball 62.4% of the time overall.
I tend to think it’s more about the Jimmy’s and the Joe’s more than the X’s and the O’s but for 2017 everyone deserves credit. The likes of Adams, Wimbush, and Nelson are among the most gifted players in the country at their respective positions and the coaches deserve a hat tip for riding the stars and tweaking the offense to suit their strengths. It’s also pretty amazing to see an offense that can operate knowing there’s a ton of trust with the defense on the other side of the ball.
For a record-setting running game you can’t just roll the ball out and run it a bunch of times and think that will lead to a bunch of wins. Everything has to work in concert, and most importantly, you have to be really effective when you do run the ball. When you look at the rushing averages above this 2017 offense doesn’t even seem real. It’s like a dream. Let’s hope it continues in Miami Gardens on Saturday night.


Not to mention under Holtz half the time we were an option team that’s supposed to run first.
Josh Adams’ ability to both run guys over and breakaway in the open field is truly incredible. The YPC average increasing each quarter seems to show that we’re wearing teams down as the game moves on (until we get to garbage time).
It’s a little silly to look ahead to next year, but I’m interested in what the distribution of carries will be next year (assuming the backs are healthy, which might be a stretch). I’ve been slow to come around on Tony Jones, but it might make sense to let him do some pounding early on in the game, then try to get the ball to Dex to bust the big one as the opponents are worn down. Of course, with Josh gone (assuming he leaves), the running attack might look completely different anyway. More sweeps with Stepherson, more QB power with Wimbush, lots of possibilities. But I’m very interested to see what Kelly and Long decide to do when one of the greatest running backs in ND history (and likely the left side of his line) are gone.
Thanks to NDNation, according to NDNation
Wow! How is this even possible? “Three, this current offense has been snapping the ball with a big lead so damn much. Funny enough, the 2016 team actually had a 15+ point lead on 17.1% of snaps and the 2015 team, despite making it to the Fiesta Bowl, only in 14.3% of snaps.”
3 big wins and a big 1st half lead in the 4th win really came out to 17.1% of all snaps?
My guess is that just because we lost in the other 8 games, doesn’t mean we never lead by 15+ in any of them.
I’ve been following ND football since ’91. Here are the starting backs I remember since then:
Rodney Culver
Tony Brooks
Jerome Bettis
Reggie Brooks
Lee Becton
Randy Kinder
Robert Farmer
Marc Edwards
Autry Denson
Ryan Grant
Darius Walker
Armando Allen
Theo Riddick
Cam McDaniel
Cierre Wood
Josh Adams
Out of that list I’d take Josh Adams or Bettis as my #1 back
There was that Julius guy as well…
Can’t believe I forgot about him!
I hear Procheese is pretty good too.
Where’s Justin Brent?
Probably throw Folston on there too
Ahh man, what about Huuuuuuuuuuuughes! and that 2012 game in the Coliseum.
Everyone I know, everywhere I go. People need some reason to believe.