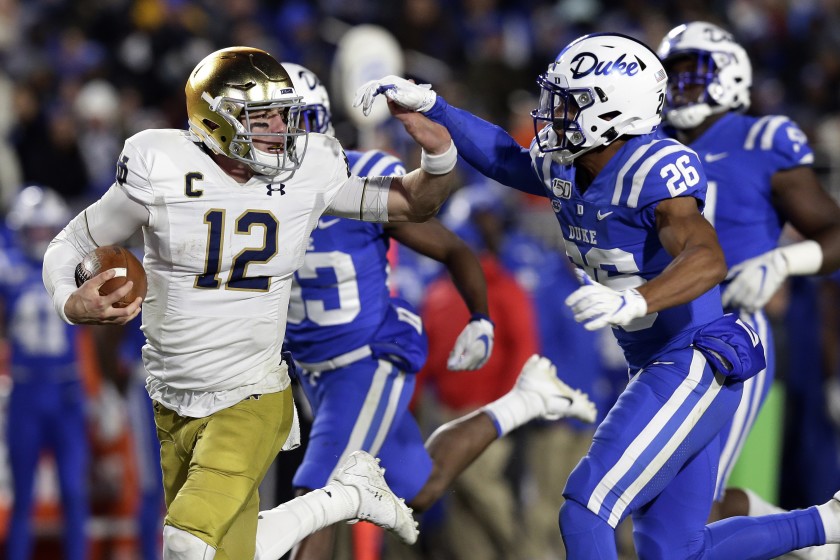
Credit to the Irish for rebounding with a huge win over a mid-level opponent – the mistakes that plagued them against Virginia Tech were largely eliminated against Duke, and accordingly the Duke game went the way the Virginia Tech game should’ve. That was the first truly stress-free performance for Notre Dame in five weeks, and it was on the road; the advanced stats recognized that and appreciated it.
Recapping the methodology again: These aren’t actual SP+ win probabilities, as SP+ creator Bill Connelly doesn’t publish those regularly after his preseason previews. We used a slightly tweaked version of the formula that the Reddit guy reverse-engineered to get close to published probabilities. That formula does some probability magic on the differential in SP+ rating for the two teams (with a bump for home field), and voilà. The FPI win probabilities are updated weekly by ESPN, so those are the real deal.
Post-Week 11 Update – SP+ Matrix
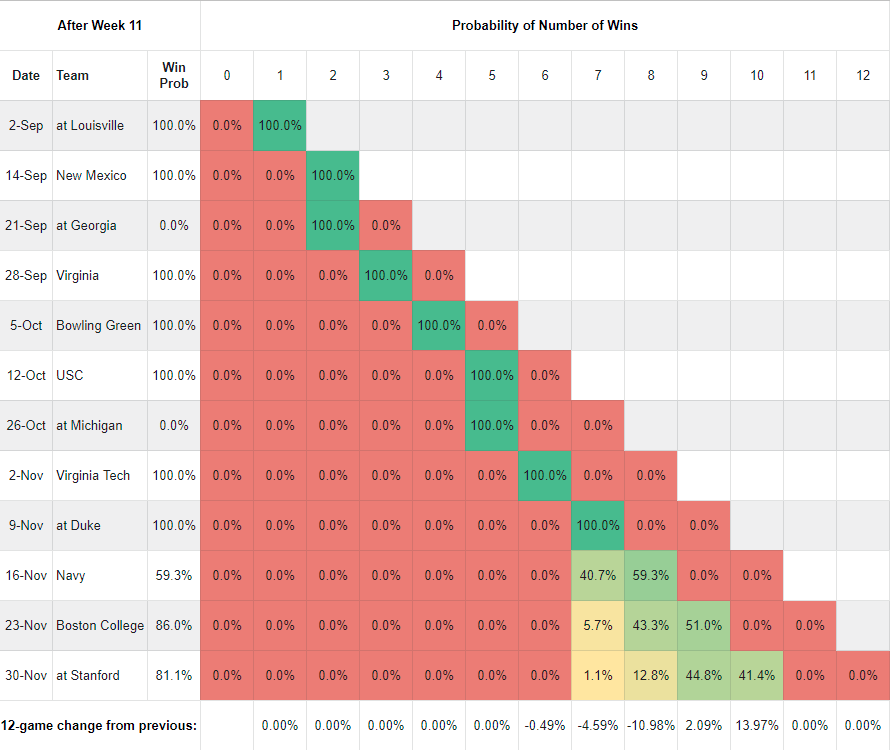
As you move down each column, you find the probability of Notre Dame owning that many wins at that point of the schedule. In the first row, you can see that the probability of owning 0 wins through week 1 is 0% and one win is 100%, since we already won. Same for the New Mexico row, and so on. In the last row, we’re tracking how much the probability of each win total has changed from the previous week. This is largely a function of our own outcomes, the quality of play that led to those outcomes, and SP+’s changing perceptions of our opponents.
The 41.4% figure at the end of the Stanford row reflects our probability of having 10 wins through 12 games – in other words, that’s our probability of winning out per SP+. That’s up about 14 points from last week, based mostly on simply getting past Duke. Note that the probability of 8-4 dropped precipitously this week, from about even with 10-2 last week to far behind it this week. Sadly, SP+ still sees 9-3 as the most likely outcome, although by a decreasing margin.
Post-Week 11 Update – FPI
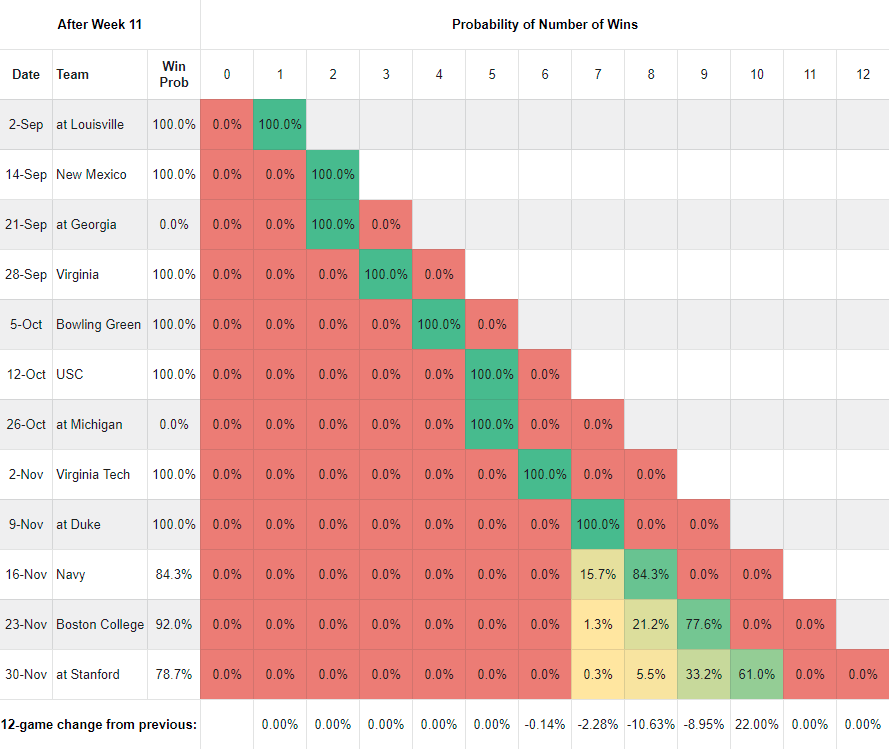
FPI already saw 10-2 as the most likely outcome last week, but by a mere seven points over 9-3. The quality of the Irish performance against Duke plus less-impressive performances by Boston College and especially Stanford now make 10-2 FPI’s most expected outcome by a very large margin.
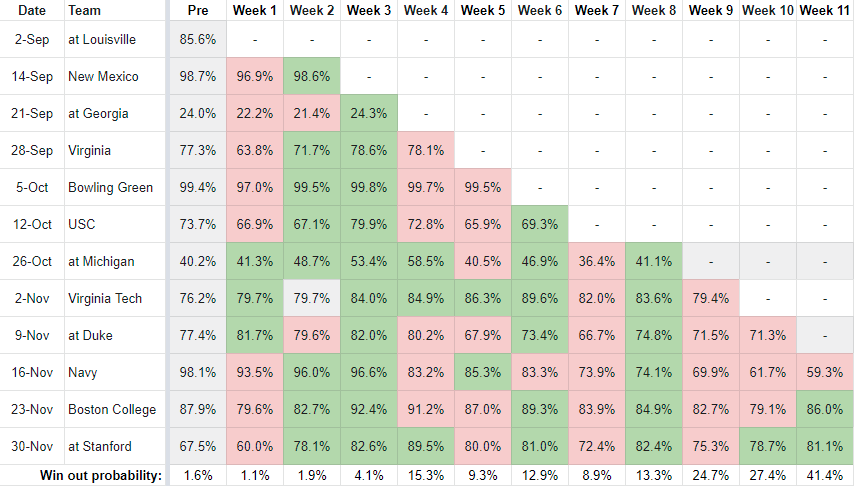
Week by Week Game Trends – SP+
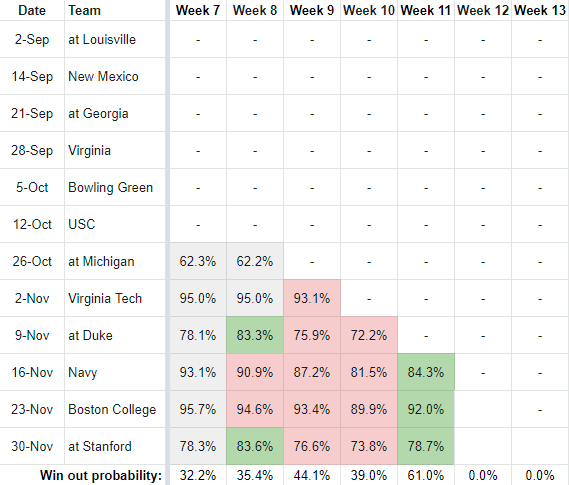
Week by Week Game Trends – FPI
Other Nuggets
- Beat to Quarters: SP+ and FPI’s differing opinions of Navy continue to leave me nonplussed. FEI has an opinion somewhere between the two of them, as it’s impressed by the Middies but its opponent adjustments are more unkind to them than SP+’s are. So lots of uncertainty in the advanced metrics, but one thing that is certain is that Notre Dame will have to bring its A game to win. The Navy defense is still a big question mark against a talented opponent, but their offense has certainly rebounded from last year’s debacle. They join Oklahoma as the only two programs in the top five nationally in both yards per carry (5th, 6.09) and yards per attempt (1st, 12.8).
- Improving Fortunes: Whatever the disagreement on Navy might be, all the metrics agree that there’s a large gap between Notre Dame and its last two opponents and that the gap is expanding. Boston College’s performance against Florida State was a classic example of the dangers of counting stats – they were outgained only 524-508, had 31 first downs to Florida State’s 19, and held the ball for over 38 minutes. They also had a whopping -3.73 yards per play differential and a cosmetic score with 0:14 left. So, not so great. Meanwhile, Stanford gave Colorado its second conference win this season in a 16-13 thriller that ended with a buzzer-beating field goal for the Buffs. Red hot PACtion, everyone.



Thanks for the updated numbers! Wow, I was shocked to see that win probability as 59% — I guess ND needs to focus on their discipline and playing mistake-free football this week. What is new with the Navy defense this year (E Hanson mentioned that they revamped their D, but did not provide details other than their stat rankings)?
I’d be interested to know too. Also last year they played and got roasted by some really good offenses (Houston, UCF, Notre Dame). This year to date Navy has played exactly one good team (Memphis) who put up 35 points on them, though only 301 yards and just 12 first downs. They didn’t have any P5 teams on the schedule this year, maybe that’s helped the stats? I haven’t watched too much but that quality of competition jumped out a bit, since they really haven’t played but one good conference team this year and had a soft OOC schedule.
I’d imagine after this week + SMU next week the rankings on Navy defense probably won’t be as nice. Hopefully, anyways.
They ditched a bad DC and hired what is apparently a good one, although as Hooks notes I would consider the jury very much out still due to the level of competition. I do think they’ve legitimately improved from last year, just not sure by how much.
ND’s win probability vs. Navy per:
SP+ – 59%
FPI – 84%
FEI – 51%
538 – 79%
Fair to say there’s quite a bit of disagreement between the models. I haven’t actually done the research on this, so it’s more of a hunch, but I think the nature of the triple option can mess with how the advanced stats models view a team. Other than that, I’m not sure what’s behind the variance.
Yeah, I would definitely think it’s the triple option aspect. Connelly did a whole write up during the off season about how SP+ doesn’t properly quantify Army from last year, and the reason he gave is that Army goes for it on 4th down something like 90%+ of the time. Since one of the major factors in Connelly’s system (SP+) has to do with “successful plays” which are based on a 3 plays and punt approach, it doesn’t respond well to an approach that consistently goes for it on 4th down most of the time… which is the triple option approach.
*An interesting thing to think about, successful plays (or “staying on schedule”) is even MORE important for the triple option than for the standard offense so in that way SP+ probably undervalues it for Navy and the like, but because they use 4 downs instead of 3, what constitutes a successful play is different, so even though it’s undervaluing, it’s simultaneously grading with an overly high bar.
The other big piece is opponent adjustments in those models seem to vary more for non-P5 teams.
On the Navy defense, there’s a good Athletic article on it today, but their new DC Brian Newberry was very good at the FCS level and has been successful being way more aggressive. They were dead last in TFL a game last year and are up to 25th or so this year. They are immensely better than last year and it makes me think that while the degree of difficulty at Navy has to be high their last DC must have been kind of garbage.
To the comment above though, against the two best offensive opponents though Tulane went for 6.7 yards a play and Memphis 7.0. To hold their other opponents below 5.0 is huge progress but also not a murderer’s row between Holy Cross, East Carolina, Tulsa, USF, UConn and Air Force (probably the best of that group but also one they are highly familiar with running the triple!).