Big ups to 18S regular Scarponi for helping us out with the arduous task of working the chart into a much more user-friendly format that shows win probability rather than loss probability. His 18S Award-Winner Free Subscription For Life is now secure!
As we noted last week, we’re filling in for the Reddit dude last year who created a Python script to do these charts for every FBS team. Well, sort of filling in; we’re just doing Notre Dame, because we’re very self-centered people. He got too much harassment from stupid fans about why he was so mean to their team in his preseason charts this year, so he stopped. Nice job there by the math-deficient in the college football fan base…
Recapping the methodology again: These aren’t actual SP+ win probabilities, as SP+ creator Bill Connelly doesn’t publish those regularly after his preseason previews. We used a slightly tweaked version of the formula that the Reddit guy reverse-engineered to get close to published probabilities. That formula does some probability magic on the differential in SP+ rating for the two teams (with a bump for home field). I applied this formula to the preseason ratings and nudged it a bit until most of the probabilities were within 1-2 percentage points of Connelly’s published numbers, and will rely on that formula for the rest of the season. So it won’t exactly match the official win probability for each game but it’ll be close enough for our purposes.
Post-Week 3 Update

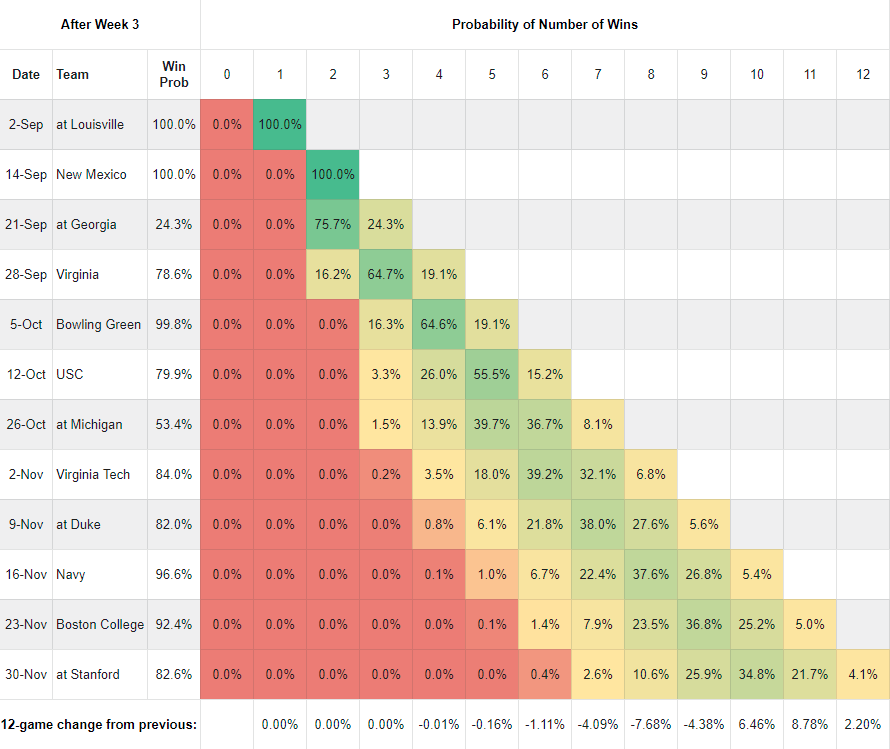
As to how to read this chart:
As you move down each column, you find the probability of Notre Dame owning that many wins at that point of the schedule. In the first row, you can see that the probability of owning 0 wins through week 1 is 0% and one win is 100%, since we already won. Same for the New Mexico row. The matrix shows that the most likely outcome after our third game is two wins, after fourth game is three wins, and so on. The 4.1% figure in the Stanford line translates to our chances to be 12-0 at this point. The color coding ranges from green for the most probable outcome to red for the least probable. From this chart, you can see that SP+ predicts 10-2 as our most likely season record at 34.8%.
In the last row, we’re tracking how much the probability of each win total has changed from the previous week. This is largely a function of our own outcomes, the quality of play that led to those outcomes, and SP+’s changing perceptions of our opponents. The demolition of New Mexico combined with poor showings by a number of opponents sent win probabilities (mostly) skyrocketing this week; note that the probabilities of 10-2, 11-1, and 12-0 all jumped substantially while those for everything 9-3 or worse fell. In fact, 10-2 or better is at the moment comfortably the most likely season outcome, with a 60.6% probability; that’s up from 43.1% last week.
Other Nuggets
- Tackling the “Big Three”: We mentioned last week that USC might vault Stanford into this group that also includes Georgia and Michigan. After each russet-mantle-clad opponent yakked on the road, I think they can stay right where they are. Also last week, I said this: “I have a sneaking suspicion that Michigan’s impending visit to Wisconsin will shift” wins over Michigan and Stanford and a loss to Georgia to the most likely Big Three scenario. Turns out we didn’t have to wait – that is the most likely outcome now at 33.4%, with losses to Georgia and Michigan and a win over Stanford next at 29.1%. The probability of sweeping the Big Three sits at 10.7%.
- Taking care of business: Notre Dame’s expected win total jumped about half a game this weekend, to 9.74 wins. If the Irish handle their business in all the games they “should” win – defined for these purposes as having a SP+ win probability of 70% or higher – that expectation jumps to 10.78 wins. That’s also half a game higher than last week.
- Price check on Charmin, please: Before the season, Notre Dame’s schedule looked to be extremely top-heavy with some maybe-decent middle teams and a pretty light bottom. After three weeks, that top-heavy portion looks really close to being one team, which is you-know-who. The win probability for Michigan started at 39% preseason and has moved to 53%, with plenty of reason to believe it could be higher by the time the game comes around. The next-lowest win probability is 79% against Virginia. Meaning as bad as you feel about facing Georgia this week, SP+ at this point says that USC, Stanford, Virginia, et al. should feel worse about facing Notre Dame.
- Carole King would be proud: Movement galore as many Irish opponents had a rough week; literally every single individual game win probability increased. To wit:
- USC moved 12.7 points to 79.9% after falling in overtime at BYU.
- Boston College moved 9.7 points to 92.4% after getting humiliated at home by Kansas. BY KANSAS. AT HOME.
- Virginia moved 6.9 points to 78.6% after struggling against a weak Florida State team (so much fun to write that).
- Michigan moved 4.7 points to 53.4% after sitting idle; Middle Tennessee State lost at home to Duke worse than they lost to the Skunkbears in Ann Arbor.
- Stanford moved 4.5 points to 82.6% thanks to a not-as-close-as-the-score-indicates 45-27 loss to UCF.
- Virginia Tech moved 4.3 points to 84.0% thanks to a true dogfight with FCS Furman, secured only when they covered an onside kick with 1:49 remaining.
- Georgia moved 2.9 points to 24.3%, probably due to a combo of Notre Dame looking good against New Mexico and Louisville looking better than Vandy so far.
- Duke moved 2.5 points to 82.0%; not really sure why, given that they played well against MTSU as noted, but I’ll take it.
- Navy moved 0.6 points to 96.6% after an idle week.
- Hapless Bowling Green, not wanting to be left out, moved up 0.3 points to 99.8%. They’re going to have to ration themselves if they want to keep playing this game.


Would it be possible to get a copy of the PNG/JPG file for the Week 2 SP+ win probability matrix?
It was fun last year to see a slideshow of how the chart changed each week from win to win. In case this year goes well, it would be nice to do the same. Thanks!
(For the record, while I probably annoyed Reddit dude last year asking questions about his methodology, color palettes, etc., I didn’t criticize his math or impartiality, so don’t blame his quitting on me.)
I track that movement behind the scenes for, not surprisingly, the “movement” bullet point. I can include this chart in future posts, not a problem. Note that basically the entire schedule has moved dramatically in our favor since Week 1. Woo!
Bowling Green gave up 35 to a Louisiana Tech team that could only score 20 on Grambling State. God, if you care about sports at all, please please please let Van Gorder hang onto that job for 3 more weeks.
Great stuff, glad it’s calibrated to be wins now, that helps my dumb brain figure it out a lot better. 60.5% chance of being another 10+ win team in the regular season, sounds pretty good!
I do wonder if this schedule will take a beating even more. USC should take a couple more L’s before rolling to South Bend. If Michigan flounders to Wisconsin as hinted that also makes the schedule look a whole lot easier, especially since Stanford might be as bad as they’ve been in years. No one else outside of UVA really looks like much a threat after this week, and even they aren’t elite.
For what seemed like a really tough schedule, it may not be so! (whispers) Especially if UGA takes a hit by losing at home 🙂
I’m with you there. There are two elements at play here, I think:
1) Our opponents, with one notable exception, are almost certainly across the board weaker than we thought they would be.
2) We’re pretty good, annoyances of the first two games aside, and that means most teams we face are going to be weaker than us. It’s an odd position to be in for an Irish fan, I know. Embrace it!
Awesome work!
If there was any question as to whether this team could make the playoffs this year with a loss, I think that has basically been answered at this point. The schedule looks incredibly weak this year compared to years past. I suppose Michigan could end up being a legitimately tough team, but I wouldn’t bet on it. UVA does have a paper thin schedule, so they could put up a gaudy W-L record and look like a solid resume victory. But who else could emerge? Georgia always looked like a must-win to make the playoffs, but I’m now fairly confident every game the rest of the way is must-win.
I think we could lose to Georgia and the door would still be open if we win out. But I think we’d “need help,” with how the rest of things fell and 11-1 would be far from a guaranteed spot in the playoff.
Ironically how the committee has treated one loss teams in the past it seems that an 11-1 ND team that beats UGA and loses to someone else actually has a better chance.
Agreed. I was just going to say the only 11-1 path for ND that I would see would be beating Georgia (and having them win the SEC title).
Losing to UGA this year is an eliminator for Notre Dame this year, IMO. SEC will probably send 2 teams, Clemson in ACC, Ohio State in Big 10, Oklahoma in Big12 all look great too at this point and that’s already 5 teams for 4 spots. ND will be easy to write off nationally with a loss to UGA, the best team they’ll play.
I don’t know about two teams from the SEC – Georgia has a history of yakking and there’s too much uncertainty everywhere except Alabama. We’ll have to see how that plays out. It’s Clemson or bust for the ACC, which means Clemson is in of course. Probably the same for the Big 12 and Oklahoma? They’re in better shape than the ACC overall but not sure anyone else there is a true threat. Ohio State looks like they’re going to murder the entire Big Ten as long as they stay focused. Pac 12 hopes likely rest on Utah and help.
12-0 ND would be in again for sure, no matter how much people might howl about whoever got left out. 11-1 ND with a win over Georgia vs. any 1-loss conference champ would be an interesting discussion. 11-1 ND with a loss to Georgia is very likely out absent carnage elsewhere.
I guess my 2 SEC teams is since Bama basically is going to get a standing invite if they go 11-1 and just the sheer volume of Auburn, LSU, UGA and Bama, there’s probably at least 2 of the top 4 teams in the country in that group in terms of talent.
It would be end times if the choice for the last spot was: 11-1 ND (that beat UGA) vs. a 11-1 Bama (that hypothetically loses to UGA in SECCG). I’m guessing at that point instead of committee looking at “who you beat” the narrative from south would shift pretty quickly to “quality of team you lost to”.
Way too many variables, but I don’t think it’s necessarily a given that Alabama gets in at 11-1. For example, if you have 13-0 ACC champ Clemson, 12-0 ND, 12-1 SEC champ Georgia, and 12-1 Big Ten champ Ohio State (or Big 12 champ Oklahoma), there’s your playoff. Even if you take 12-0 ND off the table, I can’t imagine a one-loss SEC runner-up Alabama getting in over a one-loss Big Ten champ or one-loss Big 12 champ. Maybe I’m being naive, but I think the Clemson blowout took a little luster off Alabama’s automatic bid.
I was thinking in a different direction. Let’s say ND, Clemson, Okla, tOSU and, for the sake of argument, LSU win out. We would likely be ranked #5 (everyone else already ahead of us), and would be left out.
The problem is that, no matter what we think of our schedule getting weaker, we would still have a win over UGA, and some other ranked opponent at the end of the year.
The weakest schedule of the 5 would be Clemson. They would be getting in based on the strength of last year not what they accomplished this year.
Obviously, it won’t play out that way. Clemson will win out. Their best possible remaining opponent is Virginia in the ACC championship game. As for the rest, there is a whole season to play.
Yeah, I would agree with that. I think the way to look at the committee’s evaluations is that they want to see how a team reacted when tested by quality competition. There’s an acknowledgment that teams can have bad days, so an upset won’t necessarily kill you, but there are only so many quality opponents on a schedule and when you drop those games it has to factor in.
And in fairness, an 11-1 ND that lost to Georgia would have a much weaker argument against, say, a 12-1 Georgia than an 11-1 ND that beat Georgia and lost to Virginia Tech or something. Big games have to matter more.
Yeah, I guess anything is possible, but “need help” would be more like “need a level of help we haven’t seen since the wild 2007 season” in my eyes. If Michigan truly is what I believe Michigan is, we are left with very little quality competition on the schedule.
I still don’t see how this chart predicts Irish at 10-2. Can you explain it? Thanks.
Looking at the Stanford row (ND’s last game) The square with the highest individual # is 34.8%, which is in the 10 win column.
Still means overall, there’s a 65.2% chance of NOT going 10-2, but the best individual odds are at 10-2.
Sure. As you read across each row, you get the probability of Notre Dame having that many wins at that point in the season. Since Stanford is the last game, the numbers in their row are effectively our probability of having each full-season record. So as of now, at the end of game 12 we have a 0.4% of finishing with 6 wins, a 2.6% chance of finishing with 7, a 10.6% chance of finishing with 8, and so on.
I got the 60.6% chance of going 10-2 or better by adding the probabilities of 10-2 (34.8%), 11-1 (21.7%), and 12-0 (4.1%).
I get it. Thanks guys.