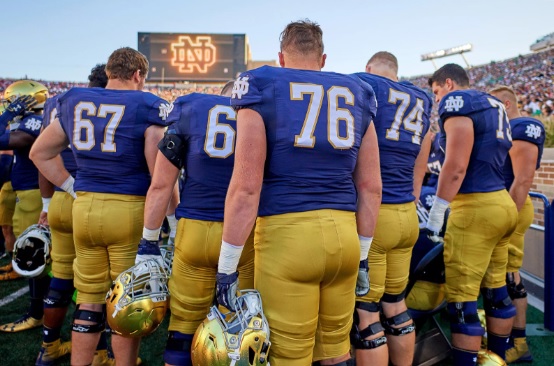
Nearly everyone saw regression coming along the Notre Dame offensive line in 2018. The Irish lost a pair of 1st round NFL picks and even with blue-chippers ready to take over it was bound to be a difficult transition. Add in the Alex Bars season-ending injury in game 5, a new offensive line coach, and a rebuilding season appeared a lock for 2018.
If you look at the traditional stats for the offense it’s not a pretty picture by any means: 52nd in rushing yards, 61st in rushing average, 35th in rushing touchdowns, 42nd in scoring, and 47th in yards per play.
Certainly far from acceptable but maybe not too far from the expectations many had coming into the season. However, when you look at the advanced stats things were bad. Like, really, really bad.
Football Outsiders has been providing college offensive line data for the past 5 seasons and I pulled together the stats for each of those Notre Dame teams below. This first table shows Line Yards (LY), Standard Down Line Yards (SDLY), Passing Down Line Yards (PDLY), and Opportunity Rate (OR). Line yards assigns credit to the offensive line for lost yardage (125%), 0-3 yards (100%), 4-8 yards (50%), and over 8 yards is 0% and a highlight opportunity. Opportunity Rate is the percentage of carries that get 4 yards when at least 4 yards are available, kind of a cousin to success rate.
| YEAR | LY | SDLY | PDYL | OR |
|---|---|---|---|---|
| 2018 | 106 | 88 | 120 | 112 |
| 2017 | 5 | 11 | 20 | 11 |
| 2016 | 18 | 102 | 8 | 46 |
| 2015 | 2 | 36 | 3 | 4 |
| 2014 | 32 | 69 | 42 | 24 |
Looking at these stats, 2018 was heinously bad coming in last among the 5 years in every category except standard down line yards which was 4th best. Just looking at the drop off, both from the averages and from 2017, is astonishing. We knew the 2017 line was amazing but the 2018 looks horrible in this context.
Do additional advanced stats make things better?
Below in the next table you’ll find power success rate (3rd or 4th down carries of 2 yards or less that went for a first down or touchdown), stuff rate (carries for 0 or negative yards), plus sack rate and sacks on standard and passing downs.
| YEAR | PSR | STR | SAR | SDSAR | PDSAR |
|---|---|---|---|---|---|
| 2018 | 23 | 121 | 38 | 77 | 16 |
| 2017 | 38 | 22 | 65 | 58 | 88 |
| 2016 | 16 | 30 | 95 | 120 | 25 |
| 2015 | 58 | 87 | 56 | 88 | 64 |
| 2014 | 44 | 42 | 30 | 5 | 94 |
Things are better! The line was pretty good in pass blocking, at least.
A lot of fans get caught up in power success rate as I’ve covered numerous times in the past. It’s the most overrated stat in the game and yet the one fans tend to identify with most on the performance of an offensive line. As you can see for 2018, the line was plenty good converting 3rd and 4th down and short situations on the ground. In raw numbers, Notre Dame converted 18 of 30 3rd & short rushing attempts, Alabama 28 of 43 attempts, and Clemson 23 of 37 attempts. It’s a small amount of snaps for everyone and not that significant in the big picture.
However, look at that stuff rate. I think we may have found our focus on what went wrong last fall.
Football Outsiders’ stuff rate only takes into account carries that lose yards or gain no yards. Some others define a stuff as gaining 2 yards or fewer. So, I went back over the past 3 seasons and pulled all of the carries for 2 yards* or fewer to get a look at the differences.
*To save time, I only pulled the raw data. A 2-yard carry on 1st and goal is technically a success but I did notate that as a stuff anyway. It shouldn’t throw things too much out of whack unless one of the seasons had an inordinate amount of 1, 2, or 3 yards to go situations which I don’t think is the case.
| YEAR | YDS | AVG | STUFFS | 20+ |
|---|---|---|---|---|
| 2018 | 2,374 | 4.43 | 43.8% | 21 |
| 2017 | 3,501 | 6.25 | 33.7% | 42 |
| 2016 | 1,960 | 4.47 | 37.6% | 16 |
We knew the drop in rushing yardage and rushing average were coming from 2017. We also knew losing the explosiveness of Josh Adams and Brandon Wimbush (once he was benched) was going to take a hit on the historic rushes of 20+ yards 2017 number. Dexter being suspended didn’t help matters, either.
Yet, even in comparison to 2016 the 2018 line had nearly the same average, rushed for over 400 more yards, and was a little more explosive. But when you compare the line yards and opportunity rates above there’s a massive gap. To me, stuff rate explains so much of the discrepancy. We’re talking about 214 rushing plays for 2 yards or less for a season–at Notre Dame’s rushing attempts per game that’s over 5 full games of ONLY stuffs.
This is all the more daming when sacks and tackles for loss allowed across 2016-18 are nearly identical. Notre Dame had way, way, way too many carries for 1 or 2 yards in 2018.
An increase in carries of 2 yards or fewer by 10% from 2017 is horrific. Even the increase by 6.2% from the 2016 season is bad, amounting to 1 extra stuff per quarter for the entire season.
I also think schedule strength plays a part in these poor rankings.
S&P Defenses Faced (2016-18)
2nd, Clemson, 2018
4th, Michigan State, 2017
6th Michigan, 2018
11th, Georgia, 2017
11th, NC State, 2016
13th, Miami 2016
17th, Virginia Tech, 2016
18th, LSU, 2017
18th, Stanford, 2016
20th, USC, 2016
22nd, Miami, 2017
35th, Northwestern, 2018
37th, Boston College, 2017
39th, Miami (OH), 2017
40th, Temple, 2017
41st, Michigan State, 2016
41st, USC, 2018
42nd, Florida State, 2018
47th, Stanford, 2018
48th, Duke, 2016
55th, USC, 2017
57th, Pittsburgh, 2018
59th, Stanford, 2017
60th, Texas, 2016
61st, Syracuse, 2018
62nd, NC State, 2017
65th, Wake Forest, 2017
67th, Army, 2016
70th, Wake Forest, 2018
81st, Virginia Tech, 2018
83rd, Navy, 2017
85th, Vanderbilt, 2018
90th, Syracuse, 2016
92nd, North Carolina, 2017
100th, Navy, 2016
116th, Navy, 2018
117th, Ball State, 2018
126th, Nevada, 2016
The 2018 schedule was top-heavy with a couple of elite defenses but 10 others were in the bottom 22 and 6 out of the bottom 14 over the last 3 seasons.
I don’t think the start to the season helped at all, either. Michigan put up an incredible 22 stuffs against Notre Dame’s run game and the Irish followed that up with a paltry 2.85 yards per carry against the 2nd worst defense faced over the last 3 seasons. This was a huge hole to put themselves in for the offensive line and offense as a unit.
It’s tempting to think the insertion of Ian Book helped out the sack rates and pass blocking which is likely true to a point or that losing Wimbush’s fantastic athleticism really hurt the offensive line in the run game. Yet all of the ball carriers, including Wimbush, took a step back in terms of stuffs from 2017.
Percentage of Carries 2 Yards or Fewer 2017 to 2018
Dexter 25.6% —> 41.6%
Wimbush 27.3% —> 43.3%
Jones 31.8% —> 46.9%
Book 38.7% —> 43.5%
Obviously, small sample sizes for Dexter, Jones, and Book in 2017 (114 combined carries vs. 319 for 2018) but a precipitous fall nonetheless.
So, if we assume reducing stuffs should be priority number one for the off-season how do things get better besides generically assuming linemen will improve with more experience and 4 starters returning?
Would more of an extra tight end help? Does more Brock Wright as a H-back help? Or, should the offense spread out more? Was there a disconnect on a play like the outside zone? Were the Irish really poor at pulling linemen and allowing exposed gaps? Does the read option need more work?
One of the things about the offensive line is it’s so intertwined with the offense as a whole that it’s difficult to understand improvement without focusing on other players. For example, how much blame gets put on the running backs for the offensive line performance in 2018? This past season was probably the worst in recent memory for running backs with strong lateral ability, jump-cutting into holes, and shedding free tacklers.
This is what worries me the most about the offensive line going into 2019. Losing Josh Adams’ explosiveness hurt (36.0% and 37.8% stuffs his last 2 years on 2,363 yards by the way, still an underappreciated talent even given the OL talent in front of him) and losing Dexter Williams’ explosiveness will be a further blow. Having Jafar Armstrong and Tony Jones stepping up into that void after logging 44.4% and 46.9% stuff rates in 2018 respectively (the 2 worst marks from 2016-18 for main ball carriers) is very worrisome. Neither has displayed the ability to make guys miss and overcome extra tacklers the way the top backs in the country are able to do and I will guess that if someone in that group doesn’t take a huge leap the running game will not be that good. Due to their pedigree and experience I can see the offensive linemen getting better (although center hangs in the balance!) but it’s a tougher sell at running back.


Easy solution. Recruit more OL.
Guffaw, at the expense of tight end!?
I was going to say the same thing. 🙂
Honestly this makes me more optimistic for next year. We went undefeated and had a strong offensive performance with one of our traditional strengths, OLine, being mediocre. I trust our recruiting and player development re: OLine.
That’s actually not a bad way of looking at it.
These numbers looked worse than I expected, eye-opening to see them like this.
My question would be how much of this is QB related? If the QB on a RPO makes a bad read, chances are it’s getting stuffed. Is that really on the line? It seems like they ran a lot more this year more than ever more passive type of run/pass option so the o-line can’t really explode off blocks and isn’t trying to get downfield maybe as much as a typical straightforward running game. No clue if that theory can be supported, but just a curiosity.
Nice job quantifying a problem we all felt was there. Next question: Why? We heard “well they lost the best OL coach in CFB and 2 first rounders on the left side, one of whom was a generational talent at guard.” (Also, the Bars injury.) Is that enough to justify this step back? It might be…I don’t know. I don’t get the sense that Quinn is a BAD OL coach. I just get the sense he’s very different than Hiestand, and the transition between them may have caused a little more confusion than we thought. Also, yes our OL recruiting has been good, but I can’t help but think that the amazing quality of some of our past players has led us to assume the next generation will always have its Zach Martin or Glinch or Nelson. Whereas these guys we have now may just be “above-average” and none of them are that standout first round pick. I’m not X&O smart enough to explain it, but I remember Bill Connelly (I think it was him, on PAPN podcast) earlier this past season talking about how run games have changed in the last few years with different offensive and defensive shifts in tactics, and that it’s much more boom or bust now. Stuff rates have gone up. OCs are designing plays to hit the big run, and DCs are bringing pressure and filling gaps to try to get the stuff in the backfield. Depending on who wins on the play, it’s much more likely than it was before to have either a 1 yard loss or a 15 yard gain, instead of a 3-4 yards and a cloud of dust. Part of that I’d assume is the filtration of spread concepts around and 2nd and 3rd level defenders having to follow receivers more instead of watching the run. For those of us that grew up watching football and hearing the announcers talk about dominant teams imposing their will at the line to get that 1 or 2 yards on 3rd & 4th down, it makes it frustrating to watch your team line up and get stuffed. But OCs are more willing to accept that as the price for eventually breaking a long one. All of which means to many of our eyes, it looks like the O-line play isn’t as good–hence the complaining that even the Glinch/Nelson lines couldn’t just line up and get that 1 yard on 4th down, dammit (even though I think statistically they were as good as anyone in the country at getting it–which speaks to a larger trend). I think there’s a tendency to give credit for longer runs mostly to the back’s speed and ability to break tackles/make someone miss, whereas a short yardage play is thought to be more about the line, and this is probably a false dichotomy. How many times on long Josh Adams runs did we see Nelson or another lineman blast someone 5 yards downfield, after already taking out one… Read more »
Sigh…click the “read more” to get the paragraphs to separate.
Very good post, KG
Some thoughts on why this year was even worse than 2016.
1. @Jeff Quinn was a crony hire!@
2. The 2016 line still included Mike McGlinchey and Quenton Nelson. Yes, they were a year younger, but if we’re saying “their replacements aren’t as good!” (which is what most reasonable people are saying), then we can assume they’re replacements were also not as good when they were younger.
3. On the subject of younger. This line was younger than 2016
2016 line
LT Mike McGLinchey SR Liam Eichenberg FR
LG Quenton Nelson JR Trevor Ruhland SO
C Sam Mustipher JR Tristen Hoge SO
RG* Hunter Bivin SR Tommy Kraemer FR
RT Alex Bars JR Mark Harrell 5th
2018 Line
LT 74 Eichenberg, Liam JR 55 Patterson, Jarrett FR
LG 69 Banks, Aaron SO 76 Gibbons, Dillan SO
OC 53 Mustipher, Sam GS 61 Grunhard, Colin SO
RG 57 Ruhland, Trevor SR 78 Kraemer, Tommy JR
RT 72 Hainsey, Robert SO 75 Lugg, Josh SO
Looking at the first line (left columns) we were a lot younger this year than in 2016 (literally, we were a year younger at three positions), and that’s why I was very happy with the line. They weren’t just less experienced – they are also a year less strong.
Stop freaking out! Save that for next year when we pass final judgment on Quinn’s immortal soul.