

Blowing out a mediocre-to-bad team is a good thing! But not as good as you might imagine, apparently. FPI absolutely loved Notre Dame’s performance against Pitt, while SP+ somehow viewed it as decidedly meh. Weird, but we’ll get into it.
Recapping the methodology for these articles: These aren’t actual SP+ win probabilities, as SP+ creator Bill Connelly doesn’t publish those regularly. He does though publish his SP+ ratings every week for all FBS teams. We used a slightly tweaked version of the formula that Reddit poster rcfbuser (account deleted, pour one out) reverse-engineered using these ratings to get close to SP+’s published probabilities. That formula does some probability magic on the differential in SP+ rating for the two teams (with a bump for home field, and yes, the bump is smaller this year given the smaller crowds), and voilà. The FPI win probabilities are updated weekly by ESPN, so those are the real deal.
SP+ can be a bit wonky from week to week at first, as creator Bill Connelly intentionally works in a lot of volatility early in the season to account for reality vs. projections. Keep that in mind when you see wild swings from one week to the next; those are by design, not by accident. SP+ measures offensive and defensive explosiveness and efficiency on a per-play basis. FPI is ESPN’s proprietary metric and is much more of a black box, but we do know that it rests heavily on expected points added, which is a pretty solid advanced stat and also a per-play number.
Post-Week 7 Update – SP+ Matrix
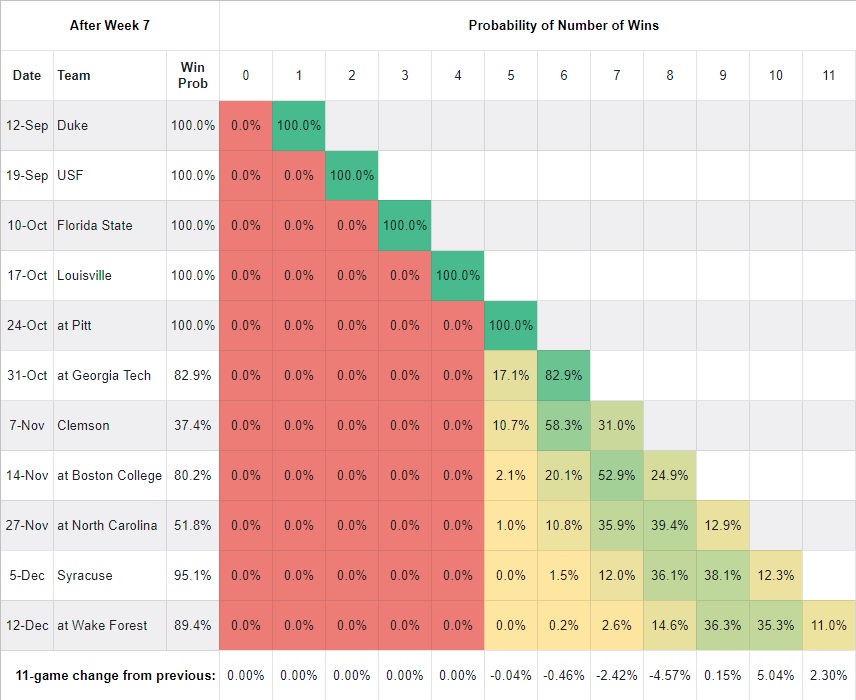
As you move down each column, you find the probability of Notre Dame owning that many wins at that point of the schedule. In the first few rows, you can see that the probability of owning 0 wins through four games is 0% and four wins is 100%, since we already won them. In the last row, we’re tracking how much the probability of each win total has changed from the previous week. This is a function of our own outcomes, the quality of play that led to those outcomes, and SP+’s changing perceptions of our past and future opponents.
The 11.0% figure at the end of the Wake Forest row reflects our probability of winning out per SP+. That’s up 2.3% from the previous week, which is a pretty good jump – and also not surprising as SP+ saw Pitt as the third toughest game remaining, after Clemson and UNC.
Post-Week 6 Update – FPI
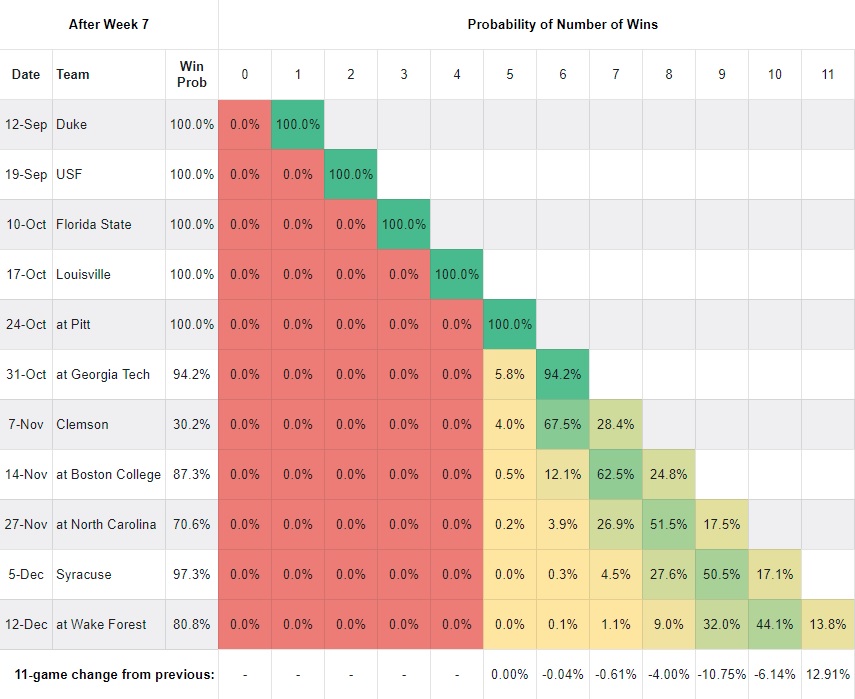
Other than in the Clemson game, for whatever reason FPI likes the Irish much more than SP+ does this year and was much more heavily persuaded by the outcome of the Pitt game. The probability of winning out before the Louisville game was 7.8%; after that and Clemson’s demolition of Georgia Tech it dropped to 5.2%, in large part due to the win probability for the Clemson game plummeting over 10 points. Move forward another week, after Notre Dame put up 38 offensive points on an above average defense while Clemson flopped around for 2.5 quarters with Syracuse, and it jumped back up 8.6 points to 13.8%, which is a very healthy number indeed.
Note that the “11-game change” row is transposed one cell to the right – the probably of winning 10 games jumped 12.91 points, not 11 games. It’s a bit of a nuisance to fix the image here because of the way the media upload/embed tool works, so… It’ll be fixed in next week’s image.
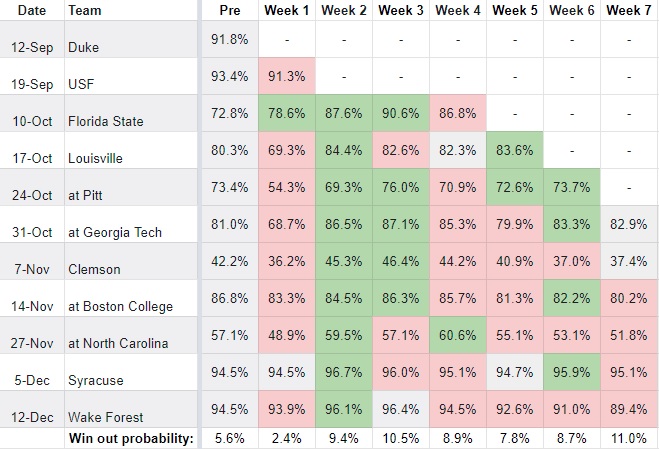
Week by Week Game Trends
| SP+ |
|---|
 |
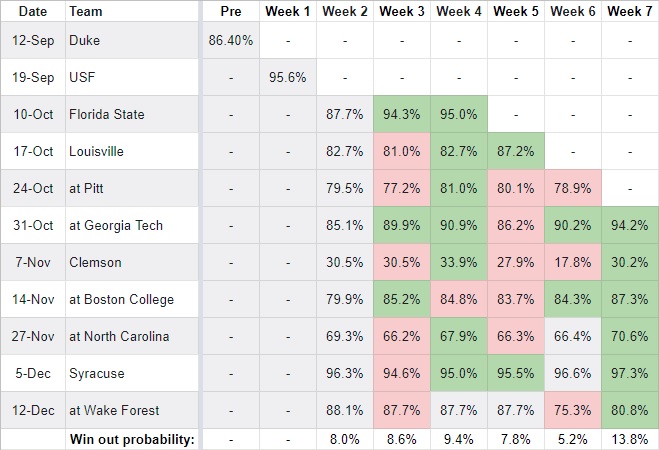
| FPI |
 |
Here we’ll track how the probabilities move from week to week. I really don’t understand why, again, 38 offensive points and a bundle of yards on SP+’s previously-17th-ranked defense and an appropriately severe throttling of a bad offense led SP+ to be less impressed with the Irish. Notre Dame was efficient, explosive, and turnover-free on offense, and almost completely prevented any efficiency or explosiveness and generated three turnovers on defense. It was exactly the kind of performance SP+ usually loves. The only thing I can think of is that preseason projections, which fade steadily as a factor in Connelly’s formula until next week, were very kind to the Irish and as they fall off more weight is being given to less impressive performances against Louisville and Duke. I can’t really make much sense of it though.
FPI, on the other hand, is enamored of the week 7 version of Notre Dame. Its 94.2% win probability for the Georgia Tech game translates very roughly to a three-score spread, which matches the current Vegas line, in contrast to SP+’s predicted 14 point spread. The other eye opener is that FPI is now 20 points higher on the North Carolina game than SP+. That 70.6% feels far more appropriate for a team that lost to Florida State, squeaked past Boston College, and posted a BVG-ian 56-45 win over a mediocre Virginia Tech squad. We shall see, I guess.
Closing Thoughts
This is a wonky year, it would seem even for the statistical models. I want to be abundantly clear that I’m not saying SP+ is inherently unfair to Notre Dame or that Connelly is tweaking it to hurt the Irish in any way. That’s silly. I have a ton of respect for Bill and all the work he has put in and continues to put in to his model. I’m just having a hard time getting a read on it this year. FPI is much more of a black box, which in addition to being unfortunately also makes me hesitant to point at it and say, “See?!? They got it right!” It’s fun to look at the two different models and try to guess at what they like and which one is closer to the truth, though.
One thing is sure: Barring utter catastrophe, there’s not much likely to change after this weekend in either metric. Notre Dame is a 20 point favorite at Georgia Tech while Clemson draws Boston College, a game that Vegas has as Clemson -31.5 and SP+ has as Clemson -26.8. Yawn (hopefully). One more week until the real fireworks start…


Sagarin is bananapants this year too. ND was #27 this time last week, then jumped to #4 after crushing Pitt.
Man the acc is not good. Is there any scenario where Nd beats unc and doesn’t end up in acc title. Is Miami the only other threat if Nd beats unc?
I’m kind of scarred as a 35 year old Nd fan. Just foresee getting handled by Clemson then having to play them again in the acc title…
Well, if BC wins out and Notre Dame loses to UNC they’d both be 8-2. But that requires BC beating Clemson and ND, so….
I don’t know how a Miami/ Notre Dame tiebreaker shakes out if both end up 9-1 in conference. Miami still has to play Virginia Tech and UNC, so it’s no guarantee they win out.
I think Miami has the edge though, first tiebreaker is head to head (not playing), second is: “Head-to-head competition versus the team with the best overall win percentage and proceeding though the conference”
Miami plays NC State and Tech, two of the better teams. ND plays pretty much just the worst teams.
So I think Miami has an edge in a tiebreaker situation right now in a situation where 9-1 is tied for 2nd? It’s early and I might not be thinking about this the right way.
Thinking further, a real dream scenario would be ND ekeing out a win vs Clemson on 11/7 and then somehow the Tigers not making it to the ACC CG. I guess ND would then have to lose to UNC, who wins out and there’s a three-way tie at 9-1 that somehow makes for a ND/UNC rematch?
Obviously unlikely to play out that way, including UNC doing their part since they’ve already lost, but that would sure be fun for maximum chaos and a full Dabo meltdown if Notre Dame joins his conference, beats him and keeps them out of the playoff.
There’s actually a couple really interesting elements to ACC Championship teams this year which hasn’t yet been talked about much that I’ve seen:
For a team to be eligible for the ACC Championship they have to have played no less than one fewer game than the league average (which if I’m reading things correctly is rounded to the nearest whole number).
Thus if somehow Clemson had 2 games canceled on them (either due to their players, or the opponents), and the rest of the league averages 10.5+ games. Clemson wouldn’t even be eligible, even if they were 9-0.
The other thing is ranking is determined by league losses, not percentage. (So 10-1 would be “tied” with 9-1.) This could lead to a weird scenario where a team could get to their final game and actually be better off canceling it due to “Covid,” guaranteeing a place in the championship, rather than risking getting knocked out by the final game. *Looking at you Miami v. UNC on Dec. 5th.*
The irony if ND were to be left out of the ACCCG and, ultimately, the playoffs because they played too many games.
You’re right, the second tiebreaker this year – in a normal year with the divisions intact there are several other steps before this – is who has the best in-conference win. Miami has a slight edge now as you note, but who knows.
Another thing to note is that if three teams finish with one loss, they first go to the three-way tiebreaker to see who gets the 1 seed and then the two-way to see who gets the 2 seed. I forget how all that works out but depending on who’s on the table it could get interesting,
All that said, UNC really shot themselves in the foot pretty badly by losing to FSU. They basically have to win out to get into the conference title game. Any other scenarios with Clemson and/or ND losing multiple times are pretty unlikely.
Is there a possibility to lose a tiebreaker to Miami, but end up ranked higher than them after they lose to Clemson, and back into the Orange Bowl that way?
As this season has progressed, I continue to be surprised at how much easier this ACC schedule is (except for Clemson) compared to ND’s regular schedules. 80%+ win probabilities for a large percentage of their games is unreal
Join a conference, they said. You’re not testing yourself enough, they said…