
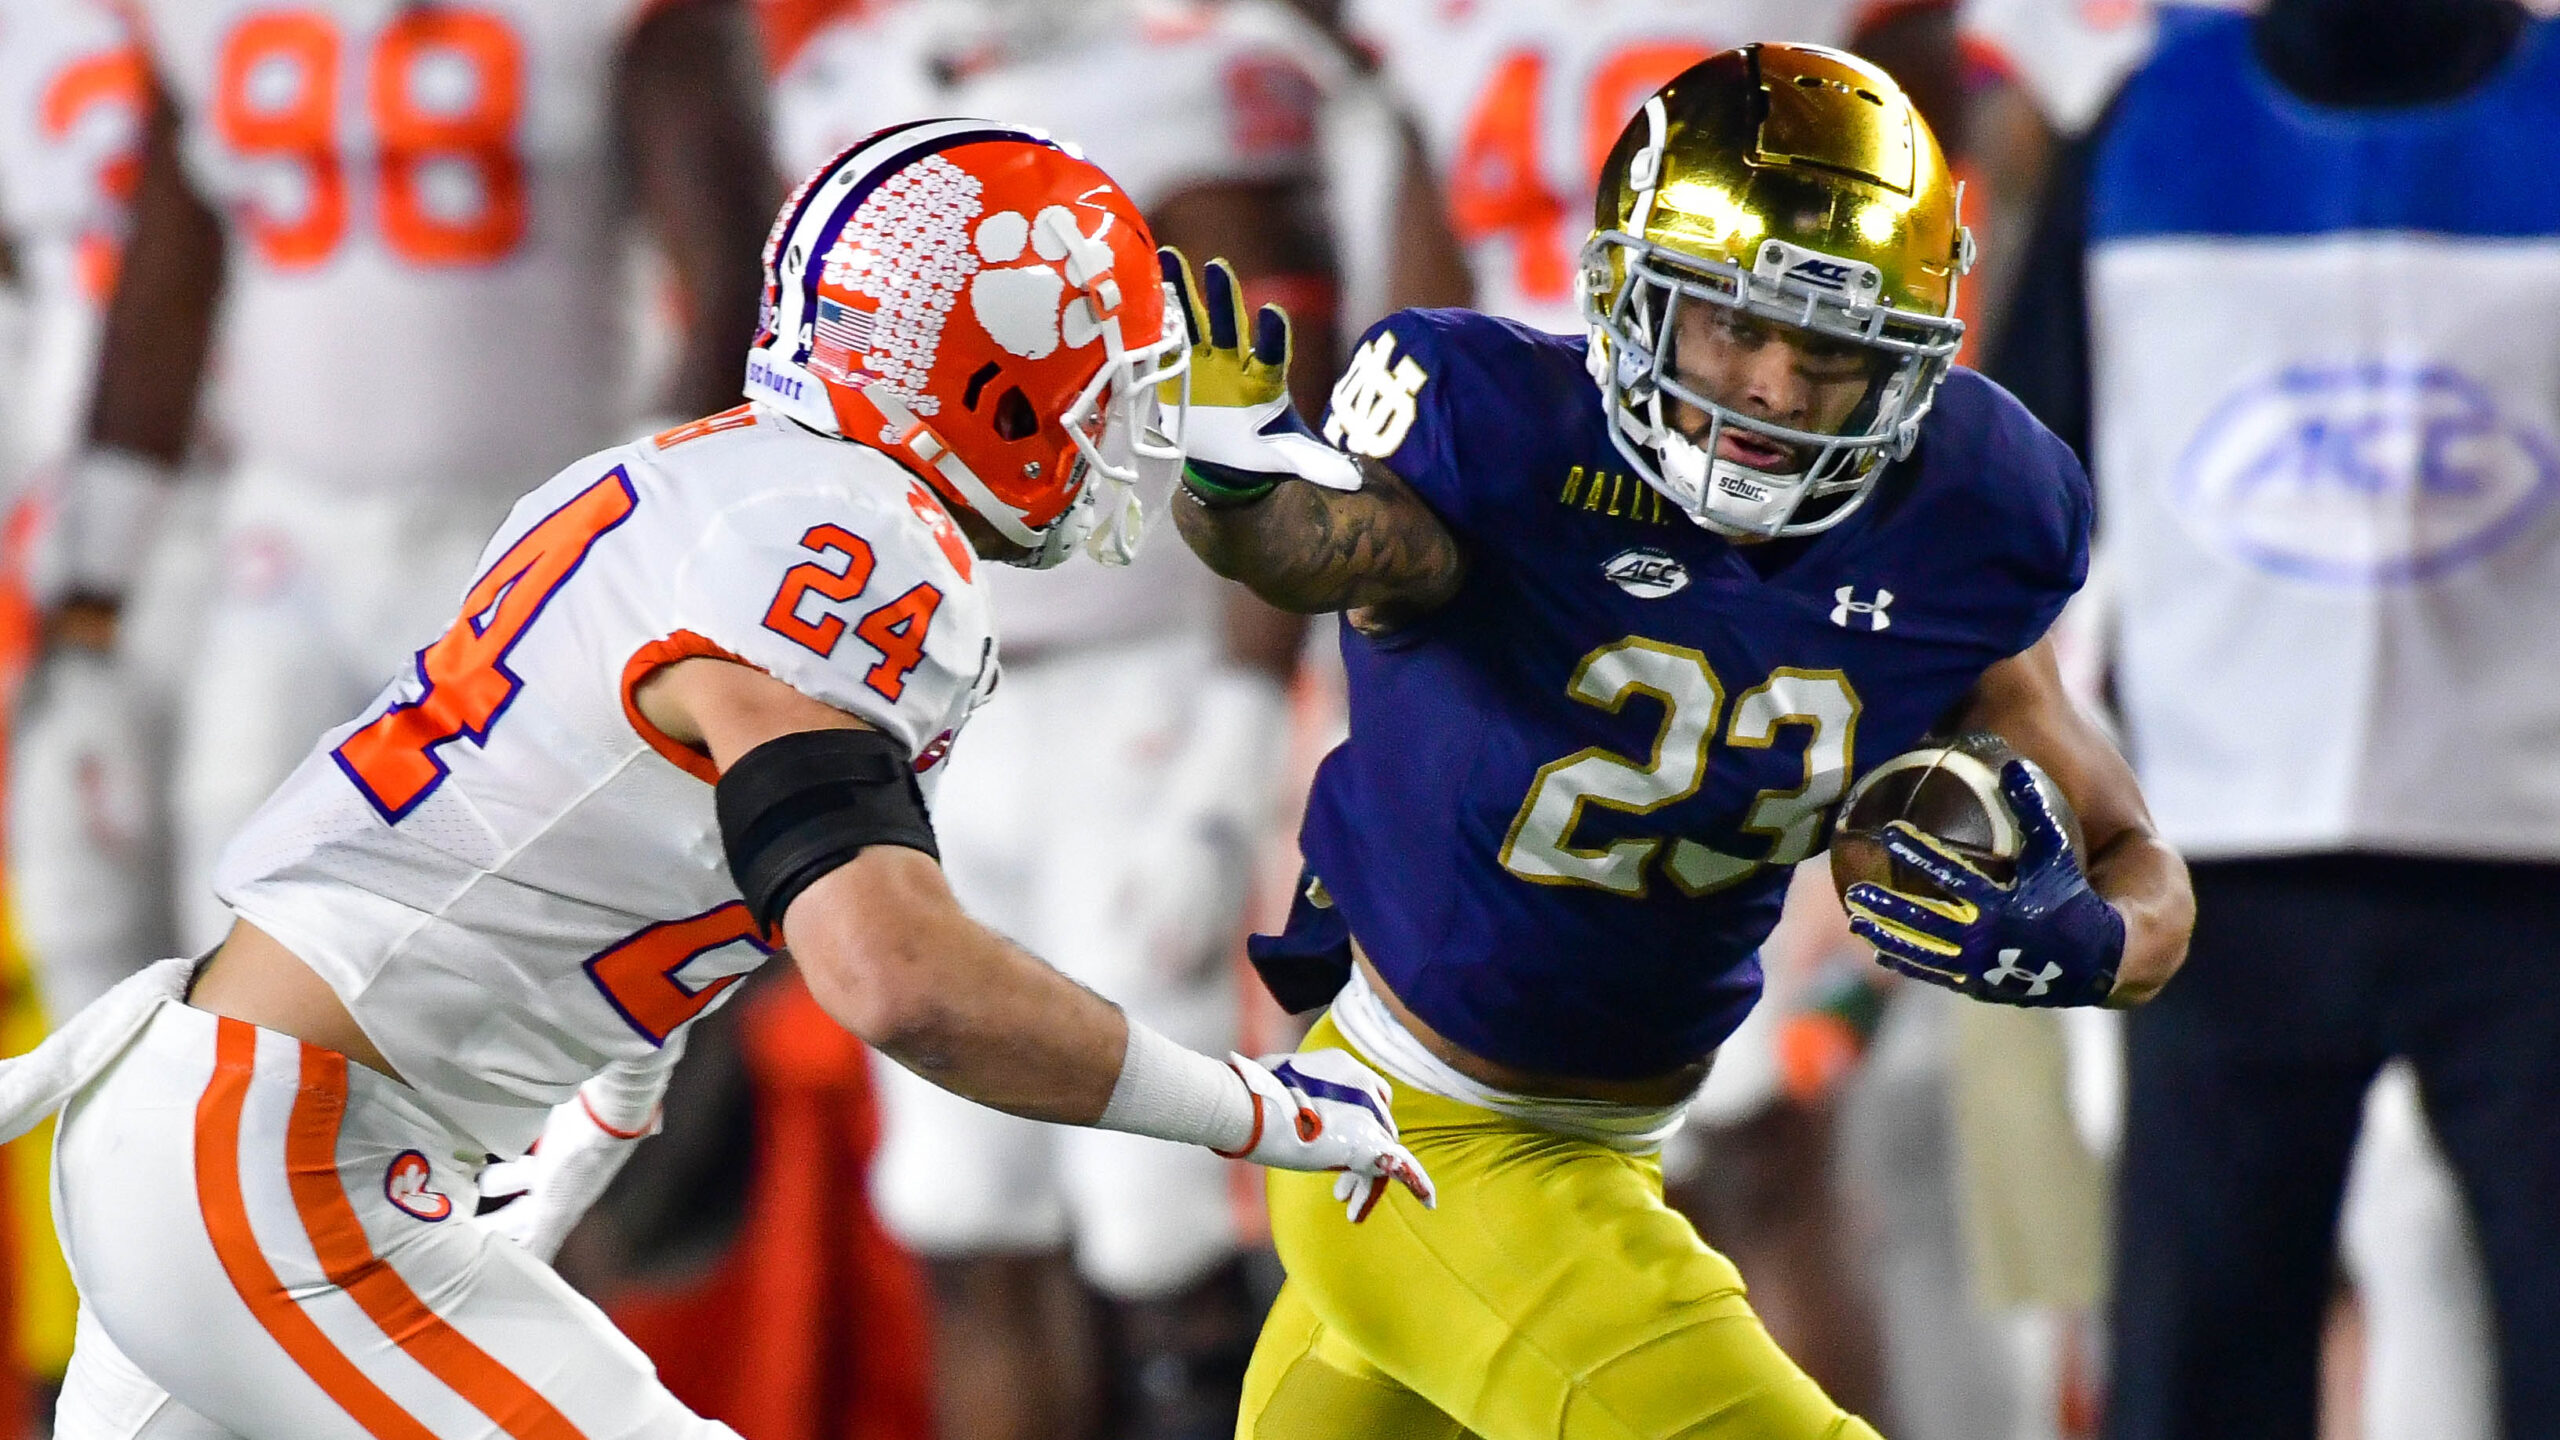
Notre Dame logged its best win of the Brian Kelly era, its best win of the last 27 years, and arguably one of its best wins ever – it was only the program’s ninth win overall versus an AP #1 team and fourth such win in nine tries at Notre Dame Stadium. (Since I know you’re wondering, the other three were achieved by Elmer Layden over Northwestern in 1936, Lou Holtz over Miami in 1988, and Holtz over Florida State in 1993.) SP+ was thoroughly unimpressed and FPI was only mildly impressed; the reasons why make some sense, but man, it was a letdown to check the probabilities this week.
Recapping the methodology for these articles: These aren’t actual SP+ win probabilities, as SP+ creator Bill Connelly doesn’t publish those regularly. He does though publish his SP+ ratings every week for all FBS teams. We used a slightly tweaked version of the formula that Reddit poster rcfbuser (account deleted, pour one out) reverse-engineered using these ratings to get close to SP+’s published probabilities. That formula does some probability magic on the differential in SP+ rating for the two teams (with a bump for home field, and yes, the bump is smaller this year given the smaller crowds), and voilà. The FPI win probabilities are updated weekly by ESPN, so those are the real deal.
SP+ measures offensive and defensive explosiveness and efficiency on a per-play basis. FPI is ESPN’s proprietary metric and is much more of a black box, but we do know that it rests heavily on expected points added, which is a pretty solid advanced stat and also a per-play number.
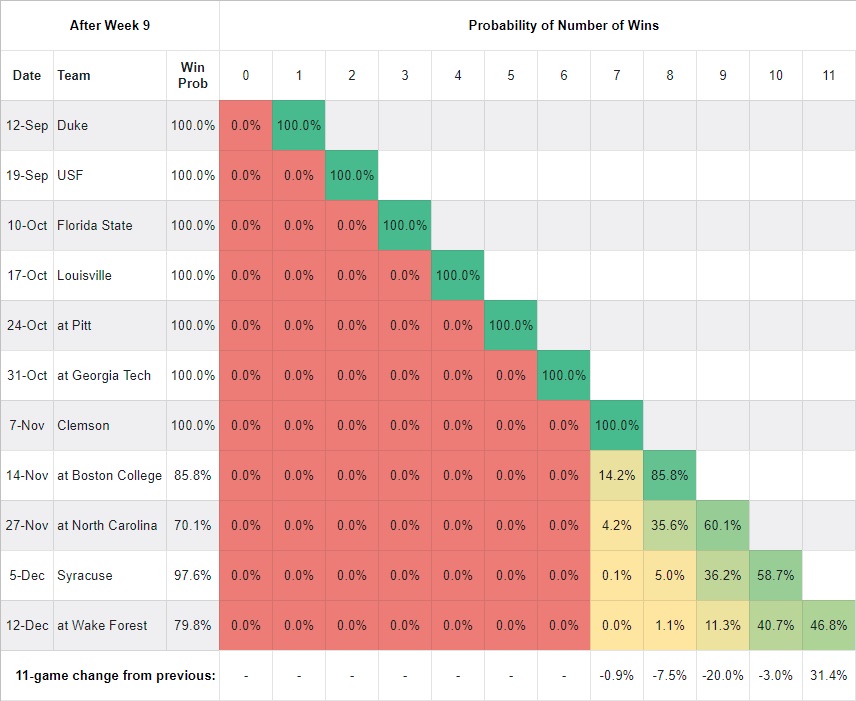
Post-Week 9 Update – SP+ Matrix

As you move down each column, you find the probability of Notre Dame owning that many wins at that point of the schedule. In the fourth row, for example, you can see that the probability of owning 0 wins through four games is 0% and four wins is 100%, since we already won them. In the last row of the table, we’re tracking how much the probability of each win total has changed from the previous week. This is a function of our own outcomes, the quality of play that led to those outcomes, and SP+’s changing perceptions of our past and future opponents.
The 33.5% figure at the end of the Wake Forest row reflects our probability of winning out per SP+. That’s up 15.0 points from the previous week, which is a massive jump – as one might expect given that SP+ expected us to lose to Clemson. It still sees 10-1 as the most likely eleven-game outcome because it sees the North Carolina game as a coin flip.
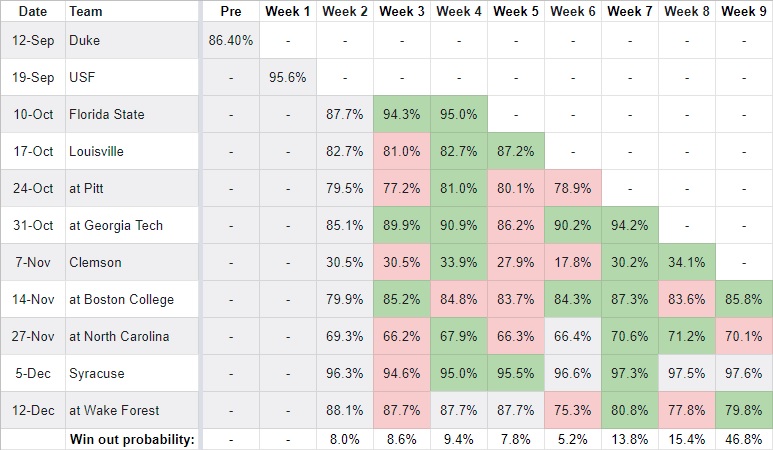
Post-Week 9 Update – FPI
Throughout the season FPI has liked the Irish more than SP+ this year, with the exception of the Clemson game. It stands to reason then that the trend would soldier on after Notre Dame won that game. Accordingly, FPI sees winning out as the most likely eleven-game outcome at 46.8%, a massive 31.4 point increase from the previous week. Interestingly, most of that shift came from a 20.0 point decrease in the likelihood of 9-2.
Week by Week Game Trends
| SP+ |
|---|
 |
| FPI |
 |
Yes folks, after beating the #1 team in the country, SP+ actually has a lower opinion of the Irish versus the remaining slate. Somehow the developments of last weekend, which saw Notre Dame knock off the #1 team in the country while Boston College squeaked past a 1-7 Syracuse team, narrowed the gap between the two teams as evidenced in the lowered win probability. I don’t get it. SP+’s postgame win expectancy for Notre Dame was 42%; that’s not totally outlandish given that (a) the game went to overtime and (b) Clemson had quite a bit of success in the passing game. How all the game performance and schedule adjustments and opponent adjustments lead to Boston College drawing even marginally closer to Notre Dame after beating Syracuse 16-13… What’s more, Clemson’s SP+ rating went up, which means the SP+ win probability for a rematch as of today is 37.4%, almost ten full points lower than last week. I just don’t know, folks.
FPI, on the other hand, did enjoy that game – but only slightly. While it was generally positive on the rest of the regular season, it more or less views Notre Dame’s win probability in a potential Clemson rematch in the ACC championship game as unchanged. The math on that is more complicated because while ESPN shows an FPI conference title probability for each team, the calculation of that probability is not as straightforward as doing so for a definite head-to-head game. Nonetheless, both are heavy favorites to make it into the game at this point and we can approximate the calculation as such. Interesting stuff indeed.
Closing Thoughts
This feels like a good place to bring up one of SP+ creator Bill Connelly’s most common defenses of his rankings, on behalf of both the SP+ and FPI models: These models are meant to be predictive, meaningful helpful in estimating how two teams would fare against each other. They are definitely not meant to provide a ranking based on a team’s resume. Another way to look at is that SP+ and FPI are forward looking, while resume evaluation is backward looking.
For what it’s worth, there are resume measures from both models as well. Connelly provides what he calls Resume SP+; while Clemson ranks 3rd and Notre Dame 8th in regular SP+, Notre Dame ranks 5th and Clemson ranks 6th in Resume SP+. ESPN calculates a “Strength of Record” based on the FPI model; Clemson ranks 3rd and Notre Dame 7th in FPI, but Notre Dame ranks 2nd and Clemson 10th in Strength of Record.
There’s no doubt that the human voters have done a similar calculation of Notre Dame’s resume, with the Irish sitting at #2 in both the AP Poll and Coaches Poll. There’s also very little doubt that everyone – fans, voters, models – will get another chance to measure themselves against a Notre Dame-Clemson result. Notre Dame will be guaranteed a spot in the ACC title game if they beat at least three of Boston College, North Carolina, Syracuse, and Wake Forest. Clemson will be guaranteed a spot in the ACC title game if they sweep Florida State, Pitt, and Virginia Tech. Those both seem like overwhelming probable outcomes of the regular season. Buckle up, folks.


Well clearly we have to throw out these models! Seriously, though, my guess is that because ND finally played a good opponent, their statistical performance was probably slightly lower than in all of the previous games against the lesser opponents where ND built up solid statistical performances. This might be why SP did not care so much about beating the #1 team, it just saw ND in a game where it put up slightly less impressive stats. For example, ND did not fare too well in the red zone (during regulation), there was a big stretch of the game where the offense did not put the ball into the end zone, and as you noted, the defense gave up a ton of passing yards.
On the bright side, at least SP has not made any snide comments about Trevor sitting out, haha
Also, I wonder if the models rate the NC game as nearly 50-50 because (a) NC has a solid passing game, and (b) Clemson’s passing performance hurt the ND defense’s numbers against the pass. While these models are great tools, they do not take into account the fact that Lea can modify his game plan each week.
Math is for nerds, let’s win out.