
After a brief hiatus – life can be like that – we’re back with some more advanced stats fun. We’ll do the Lindsay Nelson thing and tell you that SP+ liked the Purdue game and FPI didn’t before skipping ahead to later action. Interestingly, FPI was more impressed by the Wisconsin win than SP+ was, although SP+ did like it (sort of). We actually did move the ball a little bit against SP+’s fourth-ranked defense, plus had a couple of explosive plays mixed in. SP+ weights special team success a little less, so the kick return was great but didn’t change the picture much. And it sees the turnover count as lucky; it assumes a rate of one interception for every five passes defenses (interceptions plus breakups), and we had four interceptions to go with one breakup. It did see it as a positive performance for Notre Dame, but not as emphatic as the score would suggest. If we’re being honest about it, that’s probably fair.
Recapping the methodology for these articles: These aren’t actual SP+ win probabilities, as SP+ creator Bill Connelly doesn’t publish those regularly. He does though publish his SP+ ratings every week for all FBS teams. We use a slightly tweaked version of the formula that Reddit poster rcfbuser (account deleted, pour one out) posted a few years back to approximate the official calculation. The FPI win probabilities are updated weekly by ESPN, so those are the real deal.
SP+ measures offensive and defensive explosiveness and efficiency on a per-play basis. FPI is ESPN’s proprietary metric and is much more of a black box, but we do know that it rests heavily on expected points added, which is a pretty solid advanced stat and also a per-play number.
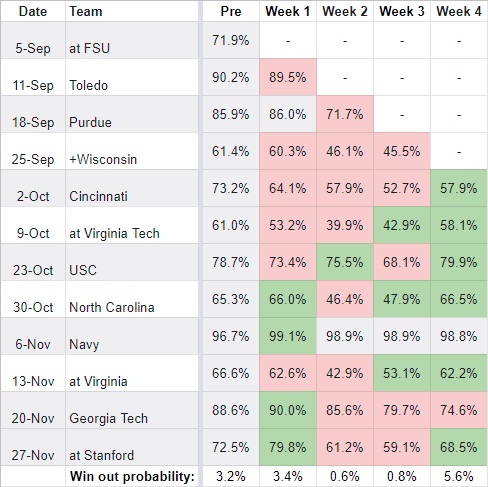
Post-Week 4 Update – SP+ Matrix
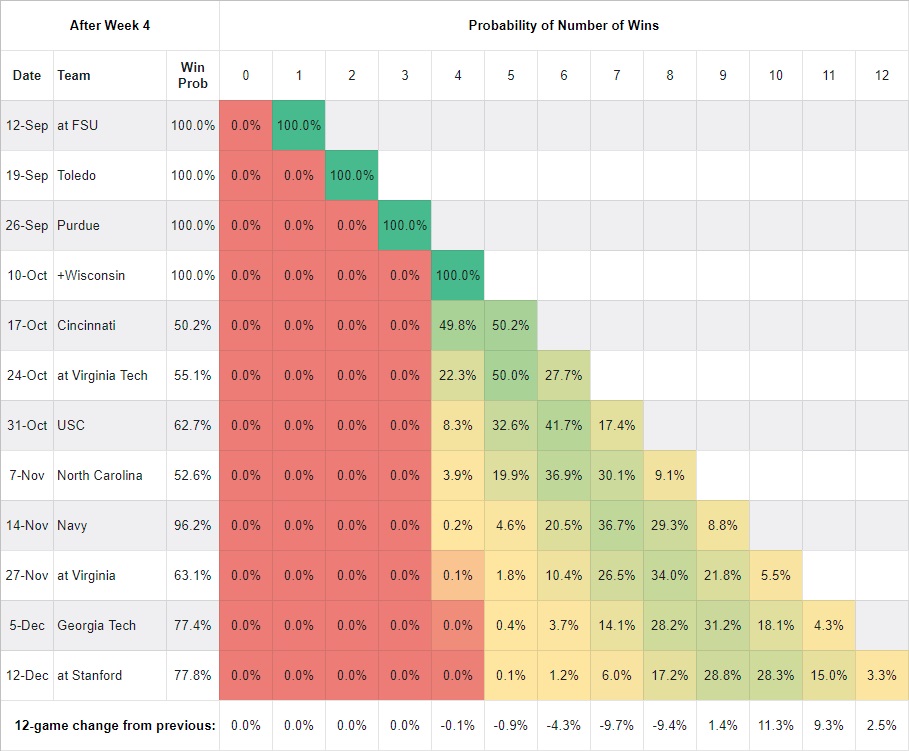
As you move down each column, you find the probability of Notre Dame owning that many wins at that point of the schedule. In the fourth row, for example, you can see that the probability of owning 0 wins through four games is 0% and four wins is 100%, since we already won them. In the last row of the table, we’re tracking how much the probability of each win total has changed from the previous week. This is a function of our own outcomes, the quality of play that led to those outcomes, and SP+’s changing perceptions of our past and future opponents.
The 3.3% figure at the end of the Stanford row reflects our probability of winning out per SP+. That’s up 2.5 points from the previous week, due mostly to three factors: putting the lowest win probability game of the season behind us, doing fairly well in our game, and future opponents flopping in some of their games. You’ll notice also that the probability of going 8-4 or worse dropped significantly, by about 24 points, with most of that shift going to 10-2 or 11-1. 9-3 is still the most likely outcome but just barely over 10-2.
Post-Week 4 Update – FPI
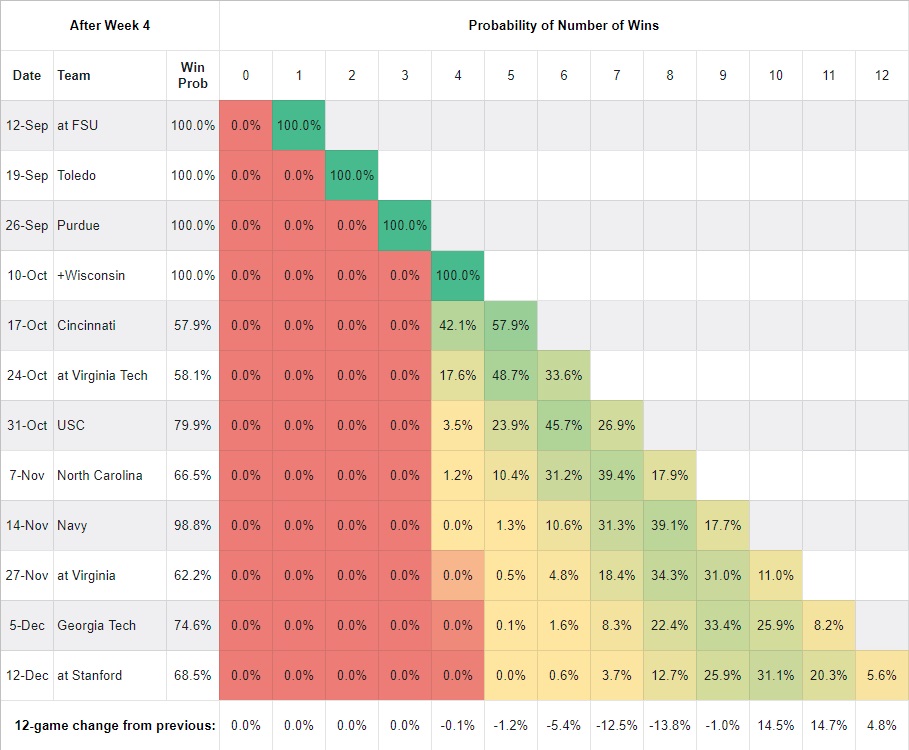
FPI was much more impressed by the win over Wisconsin, and it showed in the way almost all game probabilities swung significantly towards the Irish. It also had Wisconsin as the lowest win probability of the season. FPI now give Notre Dame a 5.6% chance of winning out; the probability of going 8-4 or worse has dropped over 30 points, and 10-2 is the most likely outcome.
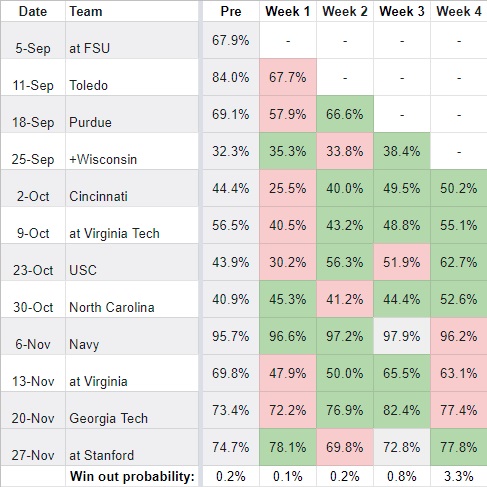
Week by Week Game Trends
| SP+ | FPI |
|---|---|
 |
 |
The only thing that really jumps out to me here is the SP+ move for the Virginia game. Virginia got manhandled by Wake Forest (they were down 20-3 at the half and lost 37-17) a week after doing the same against North Carolina (they were competitive for long stretches but lost by 20 and gave up almost 700 yards). Maybe what’s saving them is their offense, which ranks seventh nationally in yards per game, 13th in yards per play, and 27th in SP+. It’s not a big dip, but intuitively it’s odd that Notre Dame’s win over Wisconsin was less good then Virginia’s loss to Wake Forest was bad. The dip in the Georgia Tech game per both metrics is unsurprising given that Tech absolutely bodied North Carolina.
The other thing that I found really interesting here is that the gap between SP+’s predictions and FPI’s predictions is narrowing. You may remember that I noted in the post-FSU article that there was an average delta of about +20 points for FPI versus SP+’s win probabilities. Now the average delta is +4 points.
Digging Deeper
[Stephen A. voice] HOWEVER… For six of the eight remaining games, SP+ and FPI produce win probabilities within less than ten points of each other. Given the nature of the uncertainty beast here, I would suggest that’s a relatively insignificant difference – in other words, SP+ and FPI more or less agree on those games. For whatever reason, they diverge substantially on USC and North Carolina. FPI has the USC game at an 80% win probability versus SP+’s 63%; for North Carolina, it’s 67% versus 53%. The best explanation I can come up with is that, since SP+ still thinks both offenses are pretty good (UNC is 6th and USC is 16th) and both defenses are average (UNC is 62nd and USC is 64th), it also thinks that those teams have a better chance at hurting our good defense (18th) and stopping our, uh, not good offense (39th, which is probably way higher than you thought it would be). I think that in reality both defenses are putrid and both offenses will have more trouble against our clearly improving defense, but admittedly that’s the eye test talking.


These posts are always great. Interesting that Cincy is giving points this week while even the ND-hatin’ SP+ favors the Irish.
No offense to all the other in-season articles (which are always good reads) but the Win Probability Chart is my favorite.
I don’t understand many of the advanced stats, so thanks for breaking it down to manageable bites.
It’s a good thing that ND avoids Wake Forest this year — wouldn’t want to run into that buzzsaw
Ha… For what it’s worth, SP+ would favor Notre Dame by 7 on a neutral field.
Geez, did they put a wrong entry into SP+ to make it think UNC *won* 45-22 against GT and didn’t lose by that score?
It’s also weird on the VA teams as well, Tech only beat Richmond by 11 points, were well behind WVU all game until the end and their odds of beating ND now are better than before the season? And Brendan noted the UVA stuff. Hmm, sure.
FPI has been sunnier but more accurate for Notre Dame so far this year, I suppose we’ll see if that continues. I’d like to think they’re right about USC but that one still scares me more than a lot of the others in their range..
And ditto the appreciation for this series, it is very interesting! Especially considering I put a bit of change on over 9.0 wins, looking pretty good statistically for at least a push.
I don’t subscribe to ESPN+ but I eve live sp+ had Clemson at 7, which just seemed inexplicable. I guess defense but man they haven’t had anything resembling a complete performance this year
Couple of things… Yes, it likes their defense, which is ranked 2nd. That definitely buoys them somewhat. There’s also still a good chunk of the ratings coming from preseason projections; their weighting decreases by about 14% with each game a team plays. Clemson was 2nd in the preseason rankings (behind Alabama, of course) and that still accounts for about 45% of their current rating. I would guess their rank would be in the low 20s if it was based only on their performance this year.