
What a wild week, man. And that’s without even getting into what happened in our own game… Texas A&M, a week after a comeback that fell short against Mississippi State knocked them out of the Top 25, completed the comeback against erstwhile #1 Alabama – which marked Alabama’s first loss to an unranked team since Louisiana-Monroe in 2007. Not a typo. Oklahoma had a miraculous last-second touchdown to pull out the Red River Shootout and may have created a quarterback controversy in the process. New #2 Iowa (also not a typo) squeaked past Penn State in a top ten matchup; they’re now 6-0 despite averaging under 300 yards of offense against their five Power 5 opponents. #9 Michigan needed a swallowed flag to kill a final minute Nebraska drive before they could relax, which somehow impressed voters enough that they jumped idle Oregon – who, remember, did what Harbaugh has never been able to do in knocking off Ohio State earlier this year.
Crazy. What you may also find crazy is the SP+ postgame win expectancy for this game, which was 97%. This stat takes all the statistical information for the game and compares it to all the games SP+ has on record all-time to give the proportion of time in historical box scores that a team with those stats against those opponent stats won the game. That number normally translates to a multiple score win; multiple killer turnovers and Virginia Tech’s strategic deployment of kryptonite (I assume) on third down offense skewed reality away from history. Truly a wild week.
Recapping the methodology for these articles: These aren’t actual SP+ win probabilities, as SP+ creator Bill Connelly doesn’t publish those regularly. He does though publish his SP+ ratings every week for all FBS teams. We use a slightly tweaked version of the formula that Reddit poster rcfbuser (account deleted, pour one out) posted a few years back to approximate the official calculation. The FPI win probabilities are updated weekly by ESPN, so those are the real deal.
SP+ measures offensive and defensive explosiveness and efficiency on a per-play basis. FPI is ESPN’s proprietary metric and is much more of a black box, but we do know that it rests heavily on expected points added, which is a pretty solid advanced stat and also a per-play number.
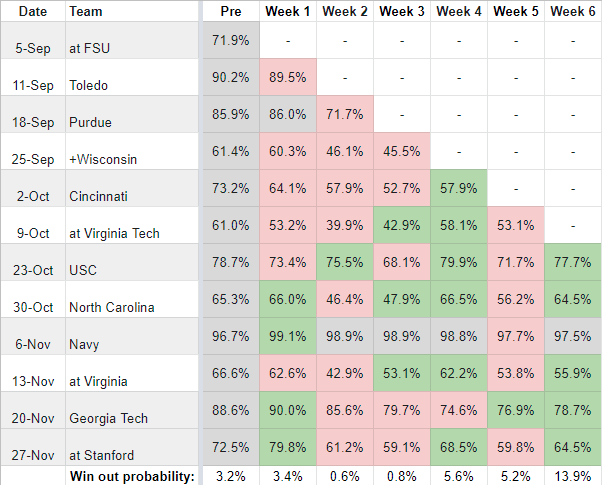
Post-Week 6 Update – SP+ Matrix
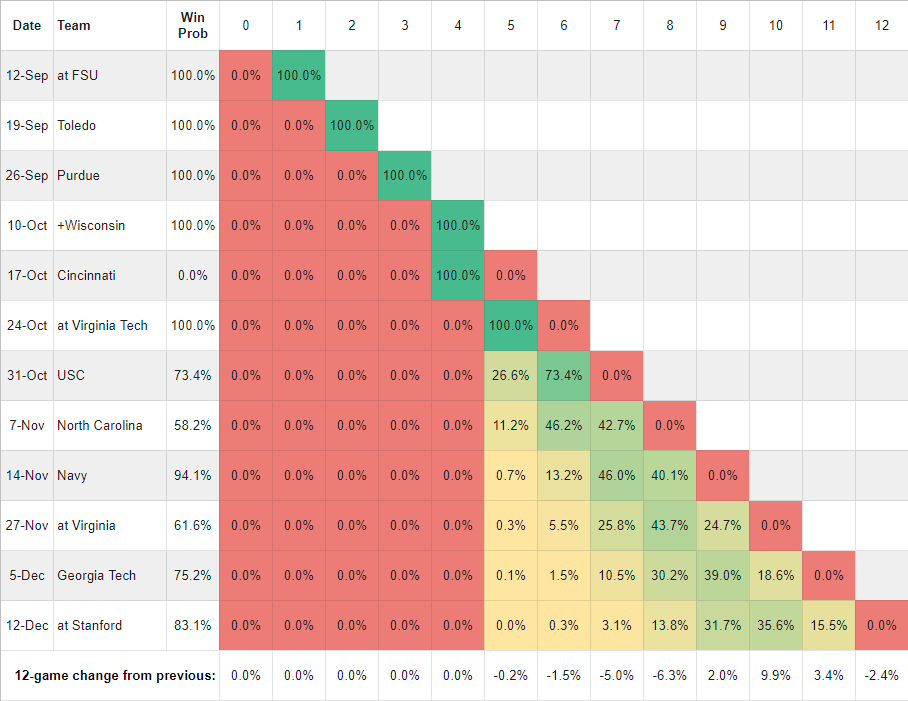
As you move down each column, you find the probability of Notre Dame owning that many wins at that point of the schedule. In the sixth row, for example, you can see that the probability of owning zero or six wins through six games is 0%, and of owning five wins is 100%. So, 5-1. In the last row of the table we’re tracking how much the probability of each win total has changed from the previous week. This is a function of our own outcomes, the quality of play that led to those outcomes, and SP+’s changing perceptions of our past and future opponents.
Notre Dame’s SP+ rating made a nice jump while the rating for four of the six remaining opponents held steady or went down; coupled with the fact that SP+ saw the Virginia Tech game as a virtual toss-up and it’s now out of the way, things are looking rosy indeed. Comparatively. The 15.5% figure at the end of the Stanford row reflects our probability of winning all the remaining games per SP+. For the first time this season SP+ projects 10-2 as the most likely record and a better-than-even chance of being 10-2 or better (52.1%).
Post-Week 6 Update – FPI
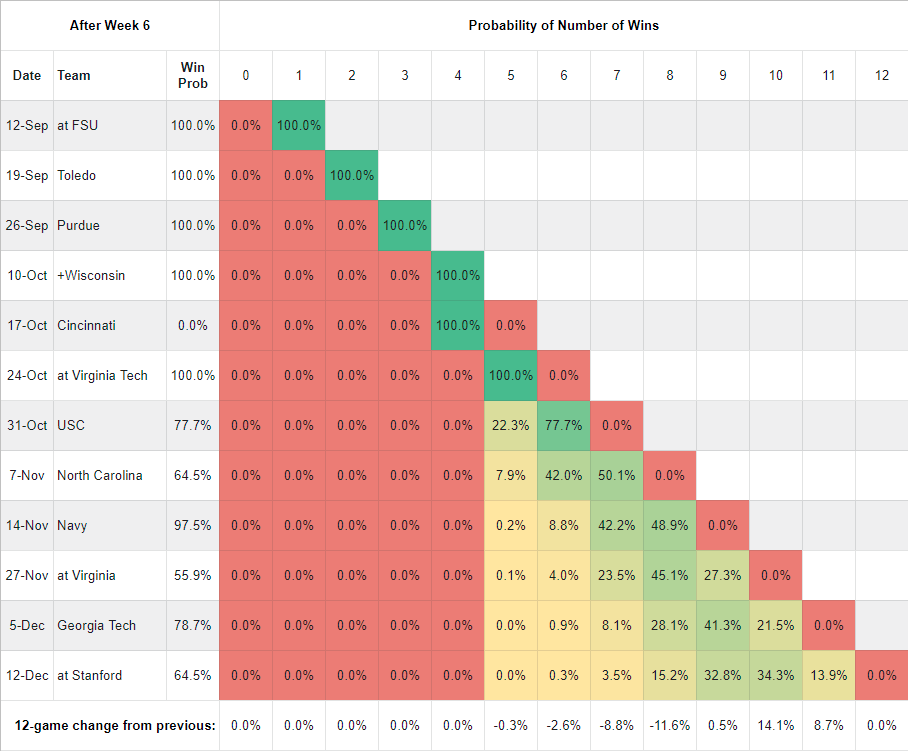
The script flips a bit this week as FPI has become very slightly more pessimistic, or perhaps we should say less optimistic, about the remainder of the season than SP+ is. This is driven primarily by the difference in how the two metrics see Stanford; FPI likes the Cardinal a good deal more than SP+ does, while their perceptions of the other five opponents are roughly equivalent.
(Really, who the hell has a tree for a mascot? So stupid.)
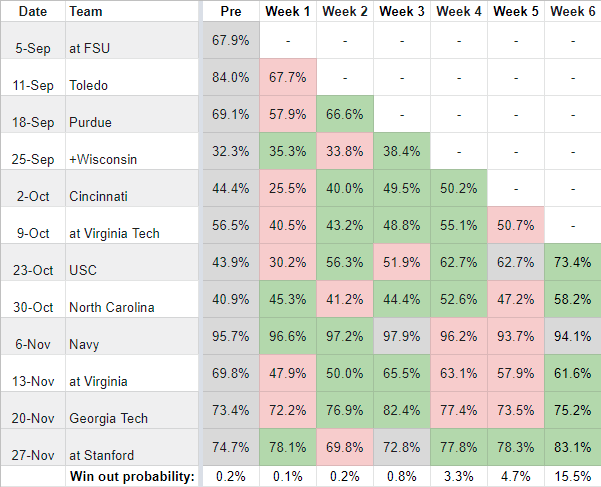
Week by Week Game Trends
| SP+ | FPI |
|---|---|
 |
 |
The week was very bloody for Notre Dame’s future opponents overall, and both metrics adjusted accordingly. To wit:
- USC got drilled at home by a so-so Utah team in a game that was not as close as the 42-26 score indicates.
- North Carolina lost convincingly to Florida State, 35-25.
- Navy lost 31-24 to SMU to drop to 1-4.
- Virginia squeaked past Louisville 34-33 after trailing by 17 to start the fourth quarter.
- Georgia Tech scored in the final minute to beat Duke 31-27.
- Stanford fell to Arizona State 28-10 in a game that gave us one of the wackiest highlights of the season. Which is saying something.
Other than Stanford, FPI and SP+ are within six points of each other on all the remaining games.
Another advanced stat note worth highlighting… In the first half of the season, the Irish faced SP+ defenses that are currently ranked 2nd (Wisconsin), 9th (Cincinnati), 25th (Toledo), 32nd (Purdue), 46th (Virginia Tech), and 71st (Florida State). In the second half of the season, they’ll face defenses that currently rank 47th (Georgia Tech), 57th (North Carolina), 66th (Navy), 82nd (Virginia), 83rd (USC), ad 95th (Stanford). Hmm.
Good point on the future defense opponents, especially the rushing defenses I didn’t see where GT is, but all the other future opponents are 80th – 113th nationally in yards/carry allowed at the moment. Seems like a natural “the OL is growing” narrative is incoming as more weeks like VT should be ahead, if not even better. This is probably good for Alt and Kristofic since they’re newer pieces, they’re bound to get some credit for stabilizing the line (even though Lugg hasn’t allowed a pressure in a while and I think Madden has gotten better as of late too).
It’s crazy that USC and UNC are 6-6 combined. And like USC as noted, UNC also made that FSU loss a closer final score with a late TD+2pt conversion, it was an 18 point lead for most of the 4th quarter for FSU. So much for those boogeymen on the Notre Dame schedule.
No surprise on UNC being a paper tiger, but I’m still trying to wrap my head around SC flushing their season down the toilet in mid-September to accomplish…nothing, apparently. I get it, Stanford is bad, but it sure looks like Helton was the glue holding that team together.
Those defensive rankings are encouraging. If we could get even one half of normal-looking offensive play (i.e. something like the second quarter against VT), who knows what we could do?
That’s some clearance sale dollar store glue though.