
As it turns out, it was not time to talk to your kids about Iowa football. Purdue’s very much non-fluky win over the erstwhile #2 team – they outgained Iowa by almost 200 yards, allowed just 86 yards in the second half, and never trailed on their way to a three-score final margin – was very good news for the Irish on a few fronts. Purdue is now the only ranked win on Notre Dame’s resume (#25 in the AP poll) and may well be the best chance at keeping a ranked win on the resume. For the rest of this season, then, we’re all Purdue fans (don’t worry, it washes off pretty easily).
It was another rough week in the top 25, although this time around there were more severe struggles in the back half than the top half. Four top 20 teams fell by multiple scores to unranked teams (#2 Iowa, #17 Arkansas, #18 Arizona State, #19 Baylor). Three top 15 teams notched single-score wins over ranked teams (#9 Oregon, #10 Michigan State, #13 Ole Miss). Irish opponents were a mixed bag but mostly did relatively well, which contributed to a minor bump in SP+ this week.
Recapping the methodology for these articles: These aren’t actual SP+ win probabilities, as SP+ creator Bill Connelly doesn’t publish those regularly. He does though publish his SP+ ratings every week for all FBS teams. We use a slightly tweaked version of the formula that Reddit poster rcfbuser (account deleted, pour one out) posted a few years back to approximate the official calculation. The FPI win probabilities are updated weekly by ESPN, so those are the real deal.
SP+ measures offensive and defensive explosiveness and efficiency on a per-play basis. FPI is ESPN’s proprietary metric and is much more of a black box, but we do know that it rests heavily on expected points added, which is a pretty solid advanced stat and also a per-play number.
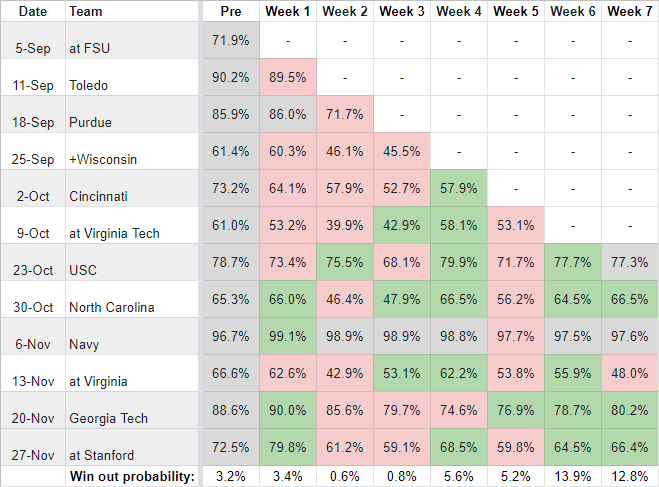
Post-Week 7 Update – SP+ Matrix
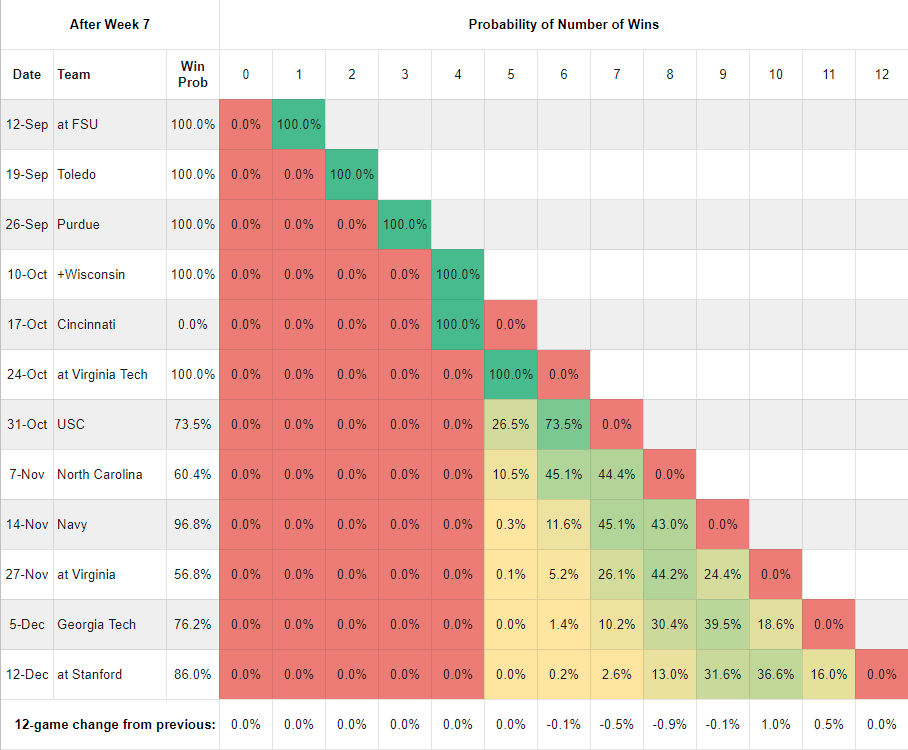
As you move down each column, you find the probability of Notre Dame owning that many wins at that point of the schedule. In the sixth row, for example, you can see that the probability of owning zero or six wins through six games is 0%, and of owning five wins is 100%. So, 5-1. In the last row of the table we’re tracking how much the probability of each win total has changed from the previous week. This is a function of our own outcomes, the quality of play that led to those outcomes, and SP+’s changing perceptions of our past and future opponents.
Notre Dame’s SP+ rating made a small jump up while the ratings for most opponents stayed fairly, which is why there’s very little change in the probability of each final win total. The 16.0% figure at the end of the Stanford row reflects our probability of winning all the remaining games per SP+.
Post-Week 7 Update – FPI
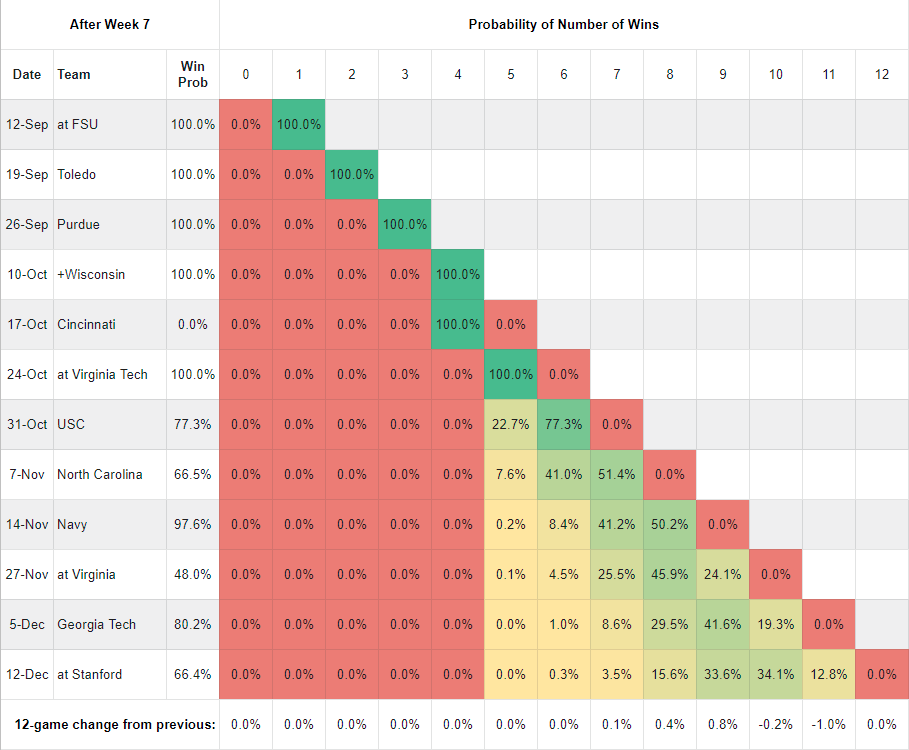
Recall that earlier in the season SP+ liked USC and UNC much more than FPI did, which made FPI more bullish on the season record than SP+ was. Well, today they agree on those games but FPI likes Virginia a little more than SP+ does and likes Stanford way more than SP+ does, so FPI is more bearish now. Not sure what they’re seeing on Stanford, who lost pretty convincingly to Wazzu right before the Cougars’ coach was canned after a protracted vaccination standoff with the university. But hey, I’m just a guy.
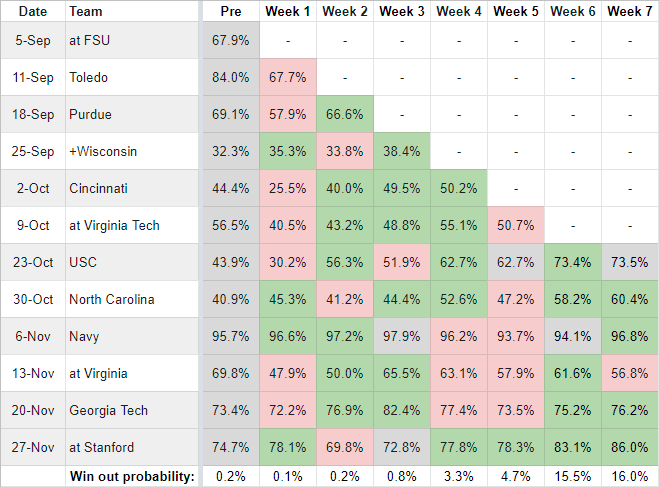
Week by Week Game Trends
| SP+ | FPI |
|---|---|
 |
 |
The Cavaliers bludgeoned Duke 48-0, which clearly made an impression on both models. I’m a bit surprised at how much of an impression it made on FPI. I mean, yeah, it was a big win, but this is the team that in its previous four games lost to North Carolina and Wake Forest by 20 (each!) and beat bad Louisville and Miami teams by a combined margin of 3 points. The advanced stats really like them though, mostly because of their offense. We’ll see!
The other thing that stands out (a bit, anyway) is that per SP+ the USC, UNC, and Stanford games are at their highest win probabilities of the year. After the opening weekend SP+ had the probability of sweeping those three games just under 11%; it now stands just over 38%.

I’m not sure why the advanced stats are concerned about Virginia. I’m assuming that BK has a solid gameplan to put in a backup QB in the 4th quarter like
KizerBuchner who will throw a bomb down the sideline to a streakingWill FullerLenzyRemember the sad
I love that many places have a throw away line about Helton being ND’s favorite coach, as much as it saddens me that he is gone.
I have a secret dream that he takes over Michigan and then Stanford.