

Another week, another effective performance against a flawed but offensively formidable opponent. This time though, the Irish offense was efficient enough that the advanced stats view the game much more positively. An advantage in yards per play, success rate, and points per scoring opportunity led to a solid bump from both SP+ and FPI, right as the schedule moves out of the preseason murderers’ row into the soft underbelly of Navy, QB-less Virginia, Georgia Tech, and Stanford. As we saw earlier in the season, this Notre Dame team is capable of losing to anyone – but it’s also hitting its stride offensively at a key moment, and could well be capable of beating (almost) anyone as well.
Recapping the methodology for these articles: These aren’t actual SP+ win probabilities, as SP+ creator Bill Connelly doesn’t publish those regularly. He does though publish his SP+ ratings every week for all FBS teams. We use a slightly tweaked version of the formula that Reddit poster rcfbuser (account deleted, pour one out) posted a few years back to approximate the official calculation. The FPI win probabilities are updated weekly by ESPN, so those are the real deal.
SP+ measures offensive and defensive explosiveness and efficiency on a per-play basis. FPI is ESPN’s proprietary metric and is much more of a black box, but we do know that it rests heavily on expected points added, which is a pretty solid advanced stat and also a per-play number.
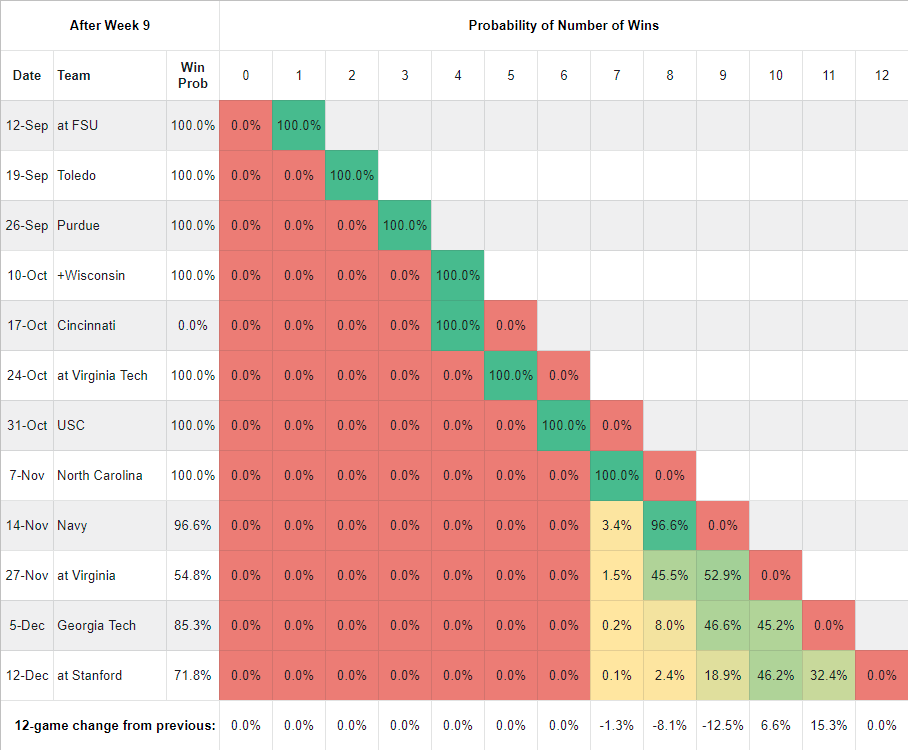
Post-Week 9 Update – SP+ Matrix

As you move down each column, you find the probability of Notre Dame owning that many wins at that point of the schedule. In the sixth row, for example, you can see that the probability of owning zero or eight wins through eight games is 0%, and of owning seven wins is 100%. So, 7-1. In the last row of the table we’re tracking how much the probability of each win total has changed from the previous week. This is a function of our own outcomes, the quality of play that led to those outcomes, and SP+’s changing perceptions of our past and future opponents.
The 33.3% figure at the end of the Stanford row reflects our probability of winning all the remaining games per SP+. That and the probability of going 10-2 are up substantially from last week mostly because SP+ viewed North Carolina as a moderately difficult game and it’s now behind us. It was impressed enough to goose the individual game probabilities higher a bit, as you’ll see below, but the biggest driver is just getting past the Tarheels.
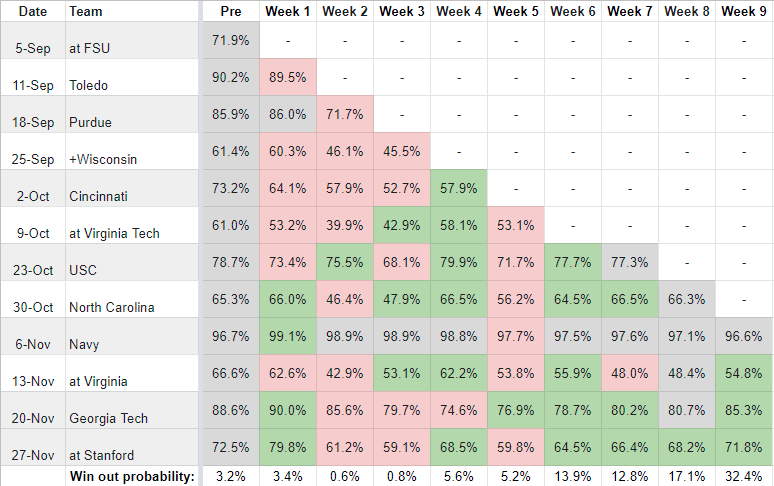
Post-Week 9 Update – FPI
It’s once again eerily similar in FPI, where a slightly tricky game is behind us and the remaining outlook is quite a bit rosier as a result. Both models still like Virginia quite a bit, but are blissfully unaware of a key injury – Virginia QB Brennan Armstrong, sort of a Sam Howell Lite, broke a rib against BYU this past weekend and is extremely unlikely to play against the Irish. Him mouthing “It’s broken, it’s broken” over and over to the BYU sideline causes me physical pain as an observer. Tough kid.
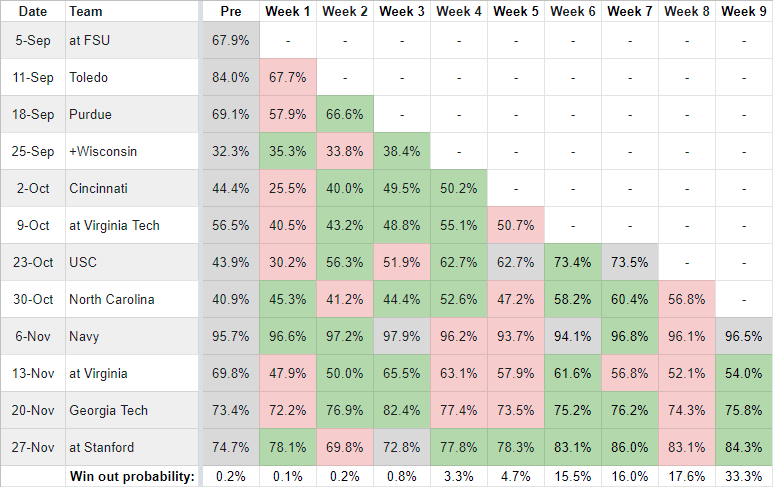
Week by Week Game Trends
| SP+ |
|---|
|
| FPI |
 |
As noted earlier, both models thought the win over North Carolina was a good and entertaining one, which clearly means neither model has a TV in its house. No positive result against Navy will impress either model, given how high Notre Dame’s win probability is in both. As always, the key to the Navy game is to get out of it (a) with a win and (b) healthy. They are B-A-D this year, ranking 123rd in SP+ offense and 82nd in SP+ defense. They’re averaging just 3.7 yards per carry and giving up 5.9 yards per play, picking up right where they left off last year; these last two years are over a full yard lower than the previous worst yards per carry number that Ken Niumatololo has posted in Annapolis. Survive and advance.


Is it weird that the worse navy is, the more worried i get? Like that game can be 35-0 before halftime and I’m still fretting. Please 18s community, talk me off this irrational cliff. I think some part of my brain has copy+pasted the 2013 and 2014 games over and over again into every season.
Navy worries me every year. I think it is the high pressure aspect that every possession is important
And they just gave Cincy a game just last week, might be a team on the upswing. Navy was never really a threat to actually win the game, but they hung around long enough to be annoying as always. Easy to see that happening.
But I’m glad Kelly acts different in these games and is more aggressive to go on 4th down more and value possessions differently, so we’ll see. The last few Navy games were all very low drama, we’re also kinda due a pain in the ass Navy game, sad to say
ND basically has only a 2-3% chance of going under its regular season o/u, which is pretty good. If this team goes 11-1, I think there’s a reasonable case that it’s the second-best in-season coaching job by Kelly after 2012.