
Oh boy, is this gonna be a fun one… You may recall that we touched on some imperfections in the 28-3 suffocation of Virginia in last week’s matrix update, and suggested that one shouldn’t try too hard to find things to be upset about. Well, the Irish handled this week a little differently than last, and they were rewarded in a big way by the advanced stats models. If a 55-0 Senior Day domination capped off by a Piesman Trophy candidate fumble return by a heart-and-soul senior captain doesn’t make you happy, and I say this in all fraternity and concern, you need a new hobby.
The Irish posted an absolutely massive 8.7-3.6 yards per play advantage, converted 50% on 3rd and 4th down versus 25% for the visitors, and averaged 13.6 yards gained on first down in the first half. When you’re that efficient and explosive, the models notice. Also worth noting that this is Notre Dame’s third straight 100% postgame win expectancy performance. Yes, the competition has dropped off, but November has been a month of absolute dominance by the Irish.
Recapping the methodology for these articles: These aren’t actual SP+ win probabilities, as SP+ creator Bill Connelly doesn’t publish those regularly. He does though publish his SP+ ratings every week for all FBS teams. We use a slightly tweaked version of the formula that Reddit poster rcfbuser (account deleted, pour one out) posted a few years back to approximate the official calculation. The FPI win probabilities are updated weekly by ESPN, so those are the real deal.
SP+ measures offensive and defensive explosiveness and efficiency on a per-play basis. FPI is ESPN’s proprietary metric and is much more of a black box, but we do know that it rests heavily on expected points added, which is a pretty solid advanced stat and also a per-play number.
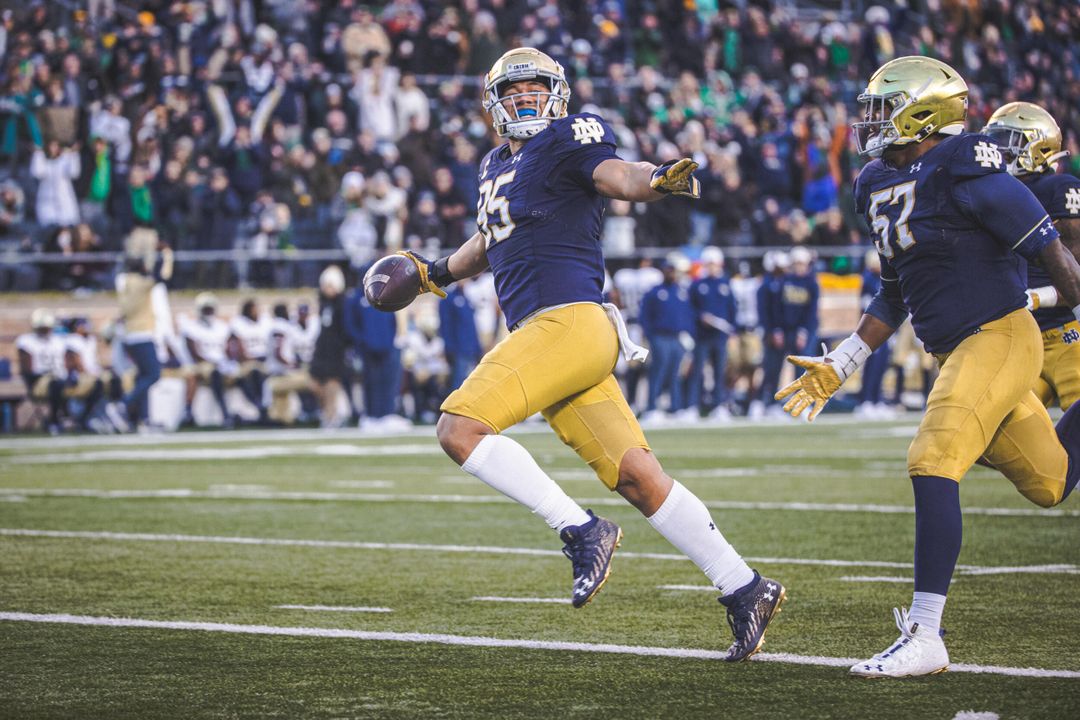
Post-Week 12 Update – SP+ Matrix
As you move down each column, you find the probability of Notre Dame owning that many wins at that point of the schedule. In the eleventh row, for example, you can see that the probability of owning zero or eleven wins through ten games is 0%, and of owning ten wins is 100%. So, 10-1. In the last row of the table we’re tracking how much the probability of each win total has changed from the previous week. This is a function of our own outcomes, the quality of play that led to those outcomes, and SP+’s changing perceptions of our past and future opponents.
We now have a 92.0% win out percentage because, of course, there is just one game left against a very bad team. Heh.
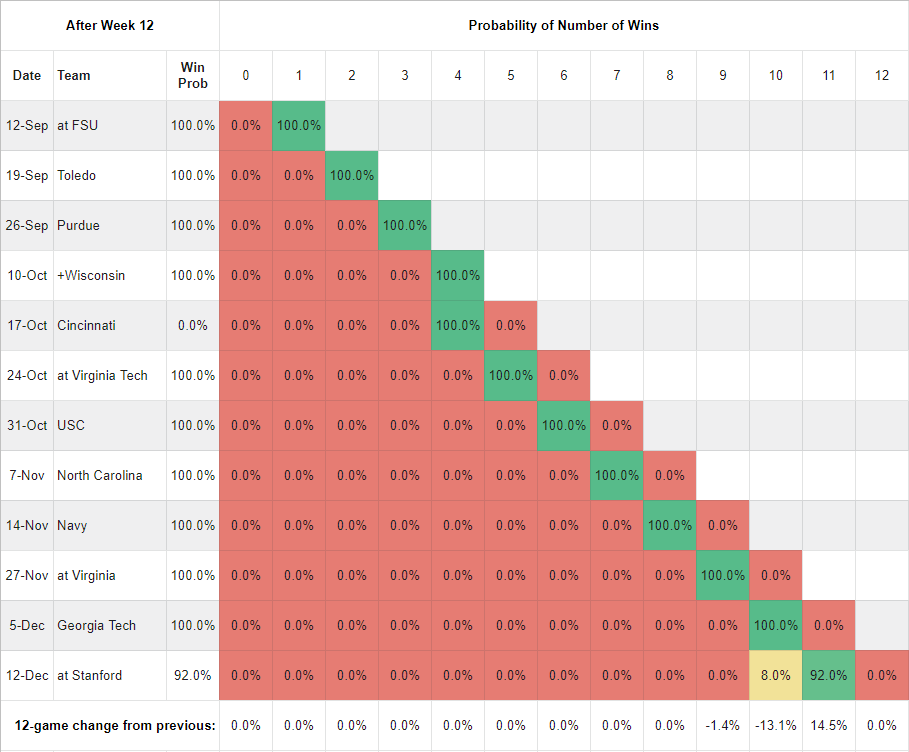
Post-Week 12 Update – FPI Matrix
FPI has liked Stanford all season, finally becoming appropriately bearish on them now after they laid and epic egg against Cal last weekend. Cal outgained them 636 to 282, outrushed them 352 (!) to 43 (!!), held a 10.1 to 4.1 yards per play advantage, and had a 75 yard run, a 76 yard run, and an 84 yard pass. Their first two drives ended in a fumble and an end zone interception; their remaining nine drives went touchdown-touchdown-punt-field goal-field goal-touchdown-touchdown-touchdown-downs. Cal, it should be noted, came into the game 3-6, and in its previous outing had provided the lonely 1 in Arizona’s 1-10 record.
Why am I telling you all this, in the middle of a win probability update?
Because it’s fun.
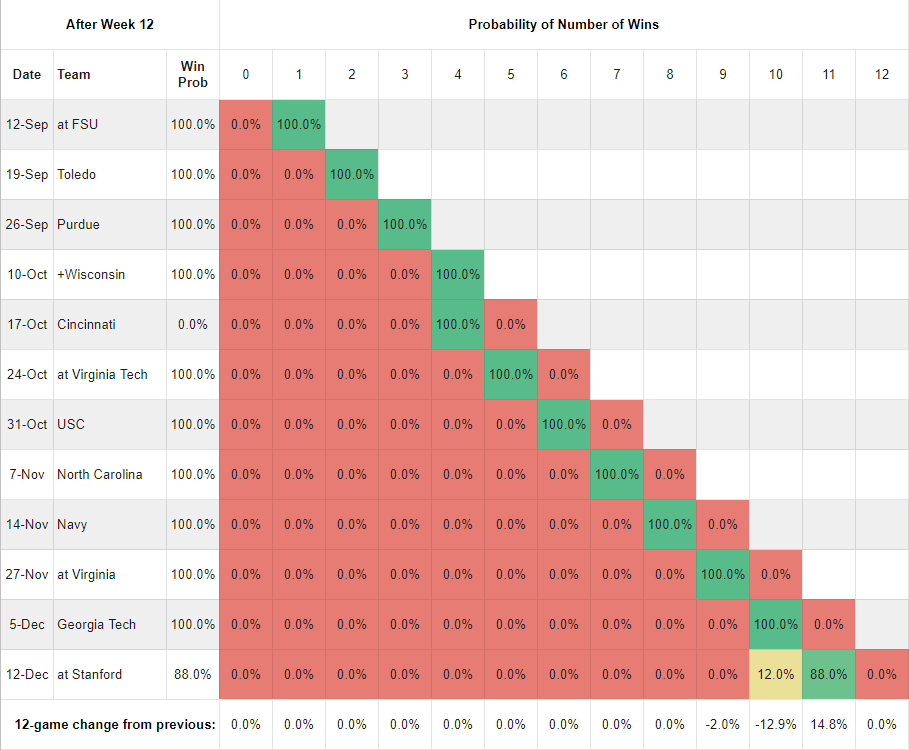
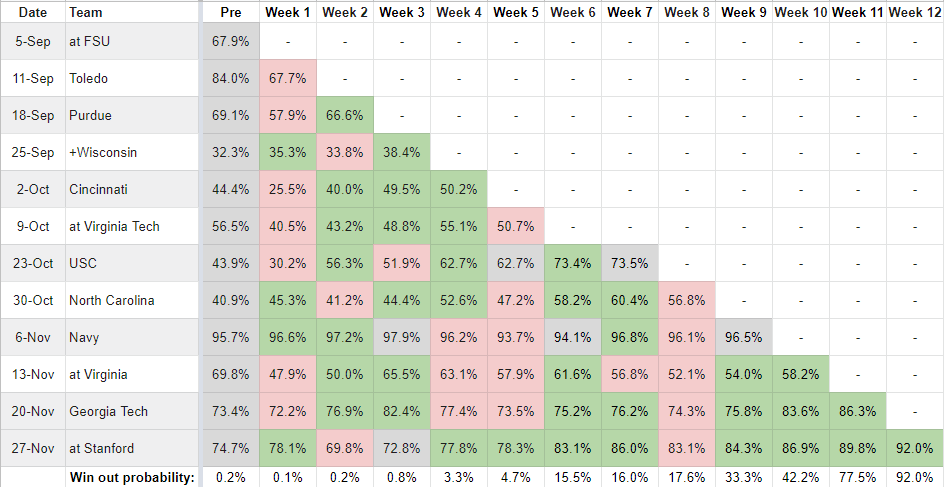
Week by Week Game Trends
| SP+ |
|---|
|
| FPI |
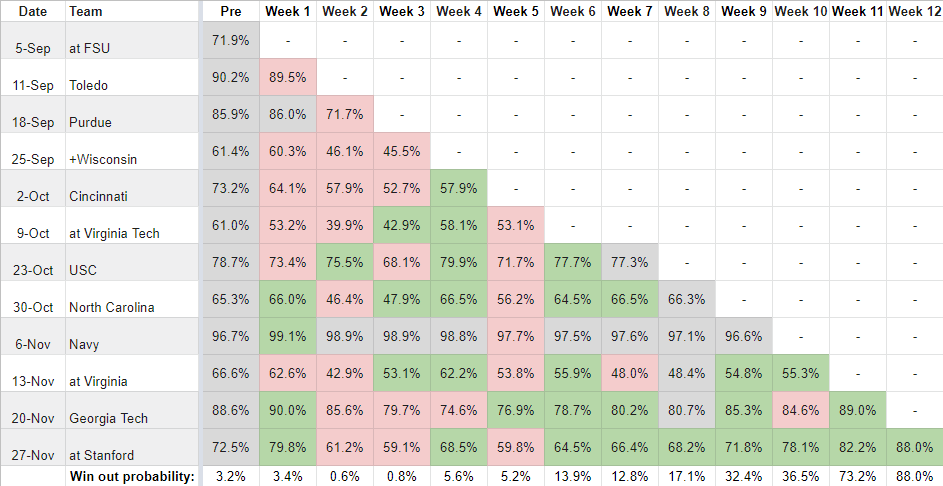 |
Not surprisingly, given the completeness of Notre Dame’s performance against hapless Georgia Tech combined with the domination of hapless Stanford by not-quite-equally-hapless Cal, the win probabilities in both models trended up again. There’s a lot of green on these charts from Week 6 forward; as we said last week, that’s a tribute to the work ethic and stubborness of every coach and player in this program. I have little confidence that the committee will put the Irish in the playoff, but being in the conversation given where we all were after Week 2, when the lads beat Toledo on a last-minute score thrown by a guy with a dislocated finger… It’s something. This will be a tough group to say goodbye to.
thanks for doing these. I look forward to these every week (at least in 10 win seasons which are becoming the norm). Every season flies by but just as this team and season started to get fun week in and week out, it’s winding down.
a fun possibility next week would be looking at win probabilities if possible bowl matchups
I was thinking of that actually – I might toss something together along those lines next week!
Not sure how likely it is, but apparently CJ Williams is looking around…at USC. The ND WR depth chart is already pretty thin, so it would hurt to lose any of their WR recruits (Walker is supposedly shaky in his commitment) but it would really hurt to lose Williams.
He’s visiting USC and UCLA, but still intends to sign early and says he’s solid with ND. Who knows whether he’s more in the Jerry Tillery vein or the true flip candidate vein.
I will say that this is what happens when you get higher profile recruits. Get used to it.
When is early signing day? Other than it being in December, it is surprisingly hard to find the exact date on the googles.
I thought I saw Dec. 20th somewhere.
Cool. Thanks!
Though now looking again this says Dec 15 (through the 17th).
https://www.ncsasports.org/recruiting/managing-recruiting-process/national-signing-day
Thanks.
It’s weird that they can sign for 2 days, but then not for another month and a half, but then again anytime after the old NSD. Oh well.
As weird as it is to type this, with USC being down (and having a bad recruiting class) this almost feels like D Greenberry choosing Houston over ND. Why? I get that USC is closer to home, but ND seems like such a better choice (stable coaching situation, winning, great recruiting class, etc)
Could just be a WR thing too, that position tends to have the myopic perspective more than most. Staying home + being the next Drake London or Michael Pittman and getting to the NFL might be a priority that could allow him to overlook the coaching situation and all. (Plus the new coach is going to sell him on the fact that by getting in place he has fixed the coaching and recruiting, even if that may or may not prove to be accurate). And it’s not like USC doesn’t get top-100 QB’s, that’s really all that matters personally for Williams.
I expect Kelly and company has to (and probably will) do a great job in the in-home visit after Stanford. It’s up to the kid what he wants to do, but they should be able to remind him about why he committed in the first place and hopefully that carries the day.
Good point about BK making a visit after Stanford. If things end up going south with Williams, I’m curious to see what ND’s contingency plan is