
Although the 2020 college football season ended with a dominant Alabama team winning a title and that’s a story we’ve seen numerous times in recent years there’s no doubt that this past year will go down as one of the strangest of our lifetimes. It was so weird at times that many of the advanced stats had a difficult time dealing with all the mania of cancelled games, shortened seasons, and no out of league major conference games. We recently spoke with Notre Dame alumnus Brian Fremeau from the Fremeau Efficiency Index to get his thoughts on this past season.
Check out our interview:
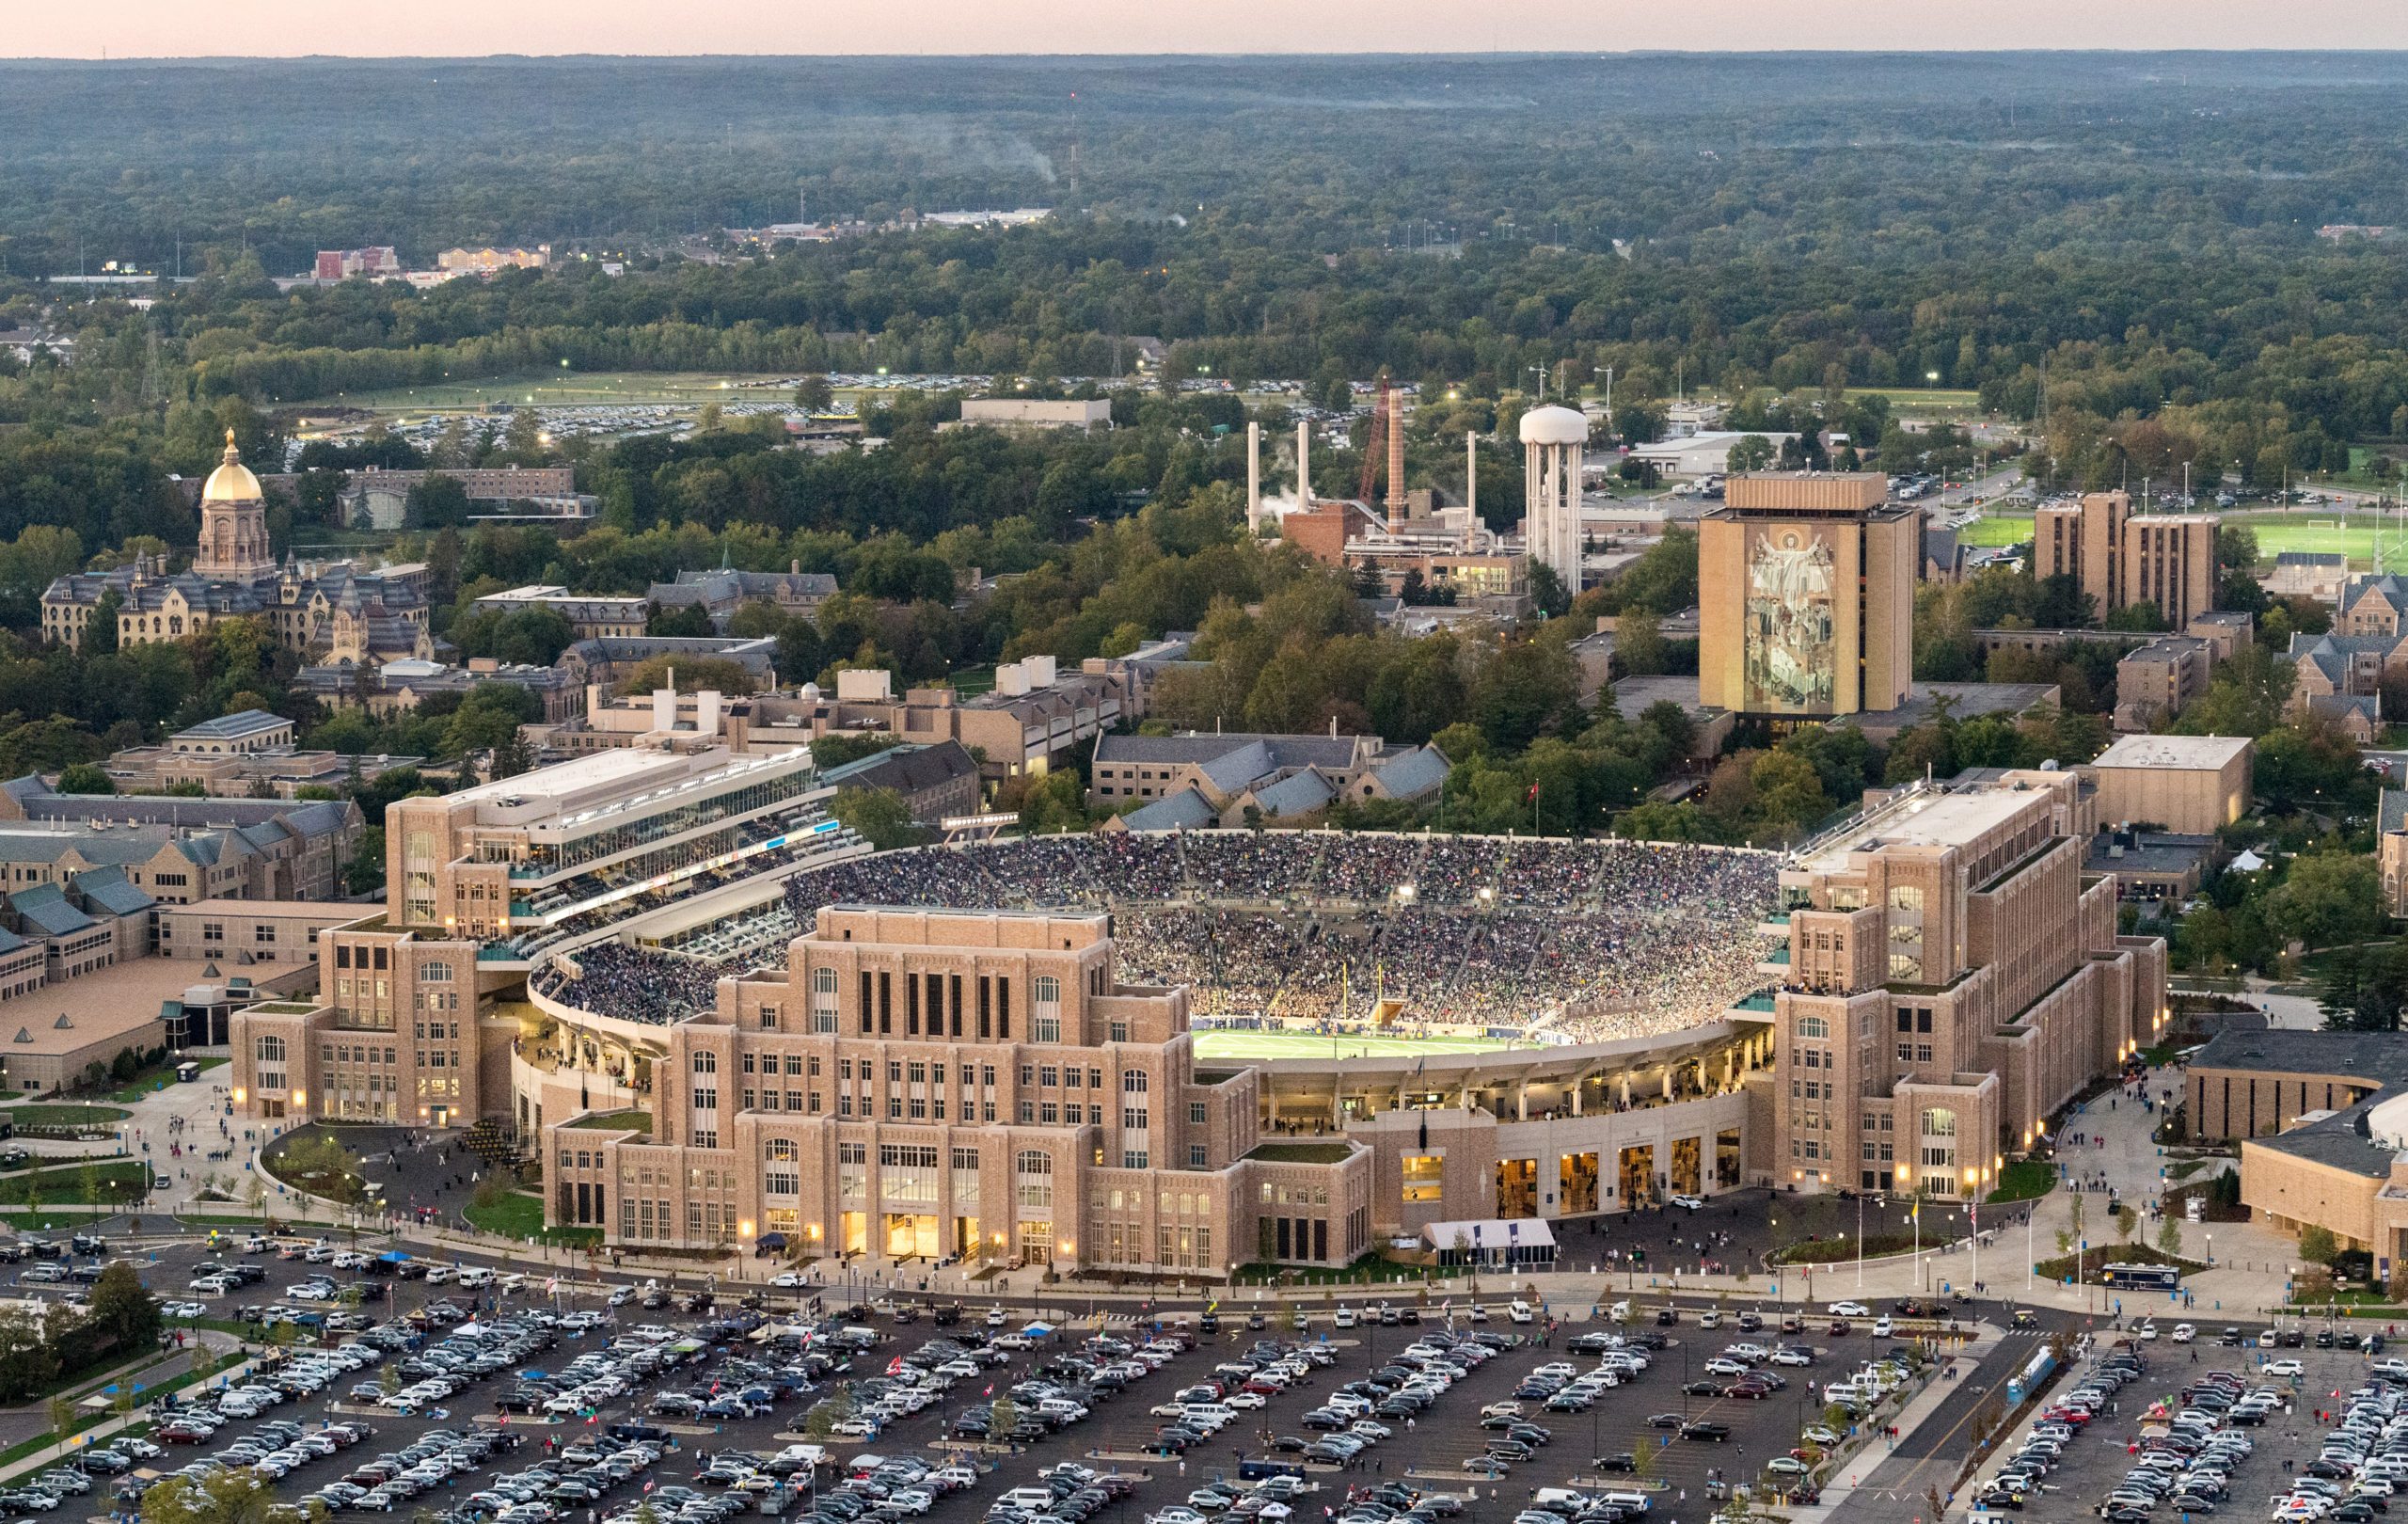
1) You’re presently the Director of Facilities for the Campus Crossroads Complex. Can you explain some of your day-to-day duties and how this massive project changed your career and the operations on campus?
Academic and student life activities drive the primary day to day operations of the Campus Crossroads Complex — Duncan Student Center, Corbett Family Hall, O’Neill Hall of Music, and Notre Dame Stadium. My team helps facilitate the “back of house” operations of the many departments, faculty, and staff that work in the buildings. We play an essential role in coordinating football game day event logistics, everything from access control management setups to operating a facility command hub that deploys utilities and maintenance personnel when operations issues are logged. And we work closely with internal and external production groups when we host special stadium events, whether that’s a movie on the videoboard for students, a Garth Brooks concert, or ESPN College Gameday.
This past year, we’ve used the buildings in so many new ways due to the impact of the coronavirus — hosting a Covid testing site, music choirs, and study spaces in the stadium concourses, for instance — and the most rewarding part of the job is finding ways to make a lot of different priorities and initiatives work in conjunction with one another.
2) How did you get started with your formula and creating FEI? Was there specific things about football at the time that bothered you regarding stats and how they are digested by fans?
I credit the 2002 ND football game against Boston College with inspiring the origins of what is now FEI. The Irish lost 14-7 to the Eagles in one of the most frustrating games I can ever recall. Boston College’s offense never crossed midfield whereas ND had six (!) possessions fail inside the BC 25-yard line. Brutal.
I started collecting drive data soon thereafter as a coping mechanism. Actually, I was initially trying to “quantify momentum” and win some arguments about the value of turnovers and go-for-it decisions with friends and family, but once I had my hands on a big enough data set, I started to better understand the value of field position and worked out the basics of college football possession and drive efficiency. The scoreboard and traditional box score certainly still mean something, but I suppose I’ve always thought of my stuff as a more detailed (and more honest?) account of how a team won or lost its games, which informs better team and unit ratings and future performance predictions. I was motivated by the same inquiries then that I am today.
3) The 2020 college football season was exceedingly weird being played during a pandemic. Do you have any insights into the wonkiness affecting your model?
The biggest problem with the 2020 season as it relates to my stuff (as well as that of pretty much every other college football data junkie) is the lack of interconnectivity between teams. Opponent-adjusted data is always a bit tricky in a typical season, with a limited number of games and imbalanced schedules both outside and even within conferences.
But it was aggravated this year in so many ways. Some teams played a relatively full schedule of games, others started their season in late October and only had a handful of results due to Covid disruptions. And there were far fewer non-conference games, which are essential to calibrating the relative strengths of 130 FBS teams.
So at year’s end when I have removed all of the preseason projection data from my formula and I evaluate teams based exclusively on 2020 data, there’s obvious wonkiness in play. My model doesn’t know that the MAC and the SEC aren’t on relatively equal footing, because those conferences didn’t play against one another, they shared no common opponents, and and shared no common-common opponents for that matter either. Buffalo and Ball State had several exceptional raw efficiency performances this year like Alabama and Florida did. But they didn’t play the kinds of non-conference games that would likely have impacted those raw numbers, and we can’t apply the same opponent-adjustments we typically would either. So we intuitively “know” that Alabama and Florida are better than Buffalo and Ball State, but the model doesn’t have any 2020 data to support that.
On the other hand, ratings of the relative strength of teams within a conference may never have been stronger than in 2020, especially in conferences that played more conference games than usual. But I have some skepticism of the utility of comparing 2020 data with any previous year, and I’ll be spending at least part of my off-season work on figuring out a suitable way to incorporate this strange year into my preseason projections for 2021.
4) We deal with fans grumbling often about the blind spots of advanced stats. Is that something you’re keenly aware of and is it always a challenge to deal with those issues when assessing your model?
Absolutely. I know when I’m sharing a data point or rating metric that it means something specific and is based only on the inputs I’m using, but it isn’t always easy to communicate those limitations effectively, especially since we’re wired to overreact to outliers. Football is complex. There are 22 players active on the field on any given play, each playing under a specific set of instructions that only their side of the ball really knows, and each performing at a level of execution that we as fans can only marginally evaluate.
Advanced stats are inherently blind to most of that as well. But I’ve found that the numbers I work with expose my own blind spots more so than the other way around. I use possession efficiency data to better understand what I see with my own eyes, and since there are so many teams playing many more games than I’d ever be able to digest, I’m able to use numbers to contextualize those results and make sense of it.
5) Is there a certain type of performance (for example, an incredibly explosive offense dominating a weaker opponent) that your model prefers over other types of performances?
My possession efficiency model favors teams that maximize their own possessions and keep their opponents from doing the same. A typical game may have around 24 game possessions, 12 for each team, and it’s games that deviate dramatically from that possession tempo that sometimes make for extreme game results.
The most dominant raw drive efficiency margin of the season in my calculations this year was a 42-0 win by Army over Middle Tennessee in a game that had only 14 total possessions, and only nine “non-garbage” possessions. How does that kind of overwhelming dominance of a limited number of possessions against a weak opponent compare with a relatively evenly played game against an average opponent? How does it compare with a dominant win against a decent or very good opponent?
My model doesn’t care precisely how your team moves the ball on a play-by-play basis, but does care about the effectiveness and results of possessions. A ball-control team that methodically moves down the field could rate as more efficient and more dominant than an explosive offense. But I’ve found that overall, touchdowns are much more frequently scored on drives that include big-chunk plays than they are on drives that chip away at the field exclusively in small increments.
6) Does your model weigh all games equally? How do you deal with adjusting for strength of schedule?
It’s more accurate to say that all non-garbage possessions are weighted equally in my model, but that also means that if Army turned around and played a 30-possession game against its next opponent, that game data would draw more weight than its exceptionally efficient, low-possession game against Middle Tennessee.
Strength of schedule as it applies to opponent-adjusted data is an exercise in comparing how a team performed on its possessions with how it would have been expected to perform on its possessions based on the strength of the opponent it faced. I evaluate those adjustment calculations every off-season with a forward-facing goal to make the opponent-adjusted output as predictive as possible for future game results.
But I also run strength of schedule calculations as their own data sets to retroactively evaluate the challenges teams faced over the course of the year. Schedule strength is all about perspective. The toughest schedule faced by an elite team would be one with several other elite opponents, even if the rest of the schedule is filled with middling teams, because an elite team is going to win the vast majority of its games against merely good or average or bad teams no matter what. But the toughest schedule faced by an average team would be significantly impacted by the mix of opponents that are good/average/bad, because those will make the difference between that average team winning 7-8 games or winning 3-4. I think these distinctions are useful tools in playoff selection debates, for instance, which I think have more to do with fairly selecting a deserving playoff field than a best playoff field.
7) Are you aware of any college football teams using your work or been approached by anyone working for a school?
I’m not directly involved with any college football teams, but there are some coaches and analysts that follow my stuff. I think some of the big-picture data analysis I do can be useful in evaluating performance, but I’m skeptical that my team and unit ratings would provide much value to a coaching staff.
Their game preparations are all about understanding precisely how a team is going to attack and defend them, and my work isn’t going to be useful for that since I’m focused on possession efficiency outcomes above all else. My numbers are designed to be fan-facing, and college football programs used some of my numbers to amplify their messages to fans and promote their teams.
8) Are you able to watch Notre Dame football games purely as a fan or does your FEI work color a lot of how you view the Irish?
Because I’m working mostly behind the scenes on home football Saturdays in my facilities role, I actually don’t watch the games much at all! (Insert “watch the games, nerd” criticism here, it’s deserved). But when I do watch the Irish, I’m certainly much more of a cerebral fan today because of my FEI work than I was 20 years ago.
I certainly still get swept up in the excitement of big games and big moments, but when I watch football, I’m paying attention to field position and often tracking possession efficiency in my mind. There’s usually a sequence or two in any game, Notre Dame or otherwise, that raises a new question in my head that my possession data set might be able to answer or contextualize.
9) What are your thoughts on recent Notre Dame teams? Is there an area or two that you’re hoping they will improve?
Big picture, Notre Dame has been really good for the last several years but is still a step behind the elite powers at the top of the college football universe (as is pretty much everyone else). Big play potential on both offense and defense is what my eyes tell me are important areas for improvement, and the data backs that up. Notre Dame’s offense ranked 23rd nationally in explosive drive rate (percentage of drives that average at least 10 yards per play), and the Irish defense ranked 58th nationally in busted drive rate (percentage of opponent drives that result in zero or negative yards gained).
I don’t think the Irish are incapable of reaching the mountain top, but the margin for error is razor thin, in recruiting, and in opportunities to contend for a championship as an independent. And I’m a big believer in success begetting success, so the last four years in particular have Notre Dame in a great position to continue to progress.
10) Notre Dame finished 10th in FEI for 2020. Does that feel about right to you based on everything you saw from the team this year?
As I said earlier, there’s some G5 wonkiness in the rankings. Notre Dame is 10th, but 6th among Power 5 teams. I think that’s about right for what I saw considering the entire body of work. They played the 2nd-toughest schedule from the perspective of an elite team and went 1-2 against the playoff field. They beat the bulk of their schedule in the manner in which you would expect a very good team to do so, so that’s exactly what they are.
11) Looking through the lens of FEI (or your personal opinion) do you like the playoffs, or prefer the old BCS system, or the wild west system before that? What changes would you make to the college football post-season?
I’m pretty conflicted on this topic. I don’t think a change needs to be made to the postseason to find a better national champion. I’m pretty convinced the current model does that just fine, and I generally respect the selection committee’s process. I think an expanded playoff field could be interesting, in that it would create more games between top teams and that’s not a bad thing even if it had relatively little impact on determining the national champion.
But if I was really charged with making changes to college football’s structure, I’d focus on changes to conferences and the regular season. Blow up divisions, eliminate conference championship games, shrink conferences down to nine teams and have each conference team play the other eight opponents once, incentivize more power teams to go independent, and incentivize strong non-conference scheduling. That’s mostly all fantasy-land stuff, I think, but I also think it would make the sport better overall — and it would give data geeks like me a richer data set to play with.
Many thanks to Brian for taking time to chat with us. You can read his work at bcftoys.com and he’s been featured at Football Outsiders, Blue & Gold Illustrated, The Athletic, and many more places. Give him a follow at: twitter.com/bcfremeau as well.
This is awesome. Had no idea Fremeau was an ND grad and even works on campus. So cool! That dude is living my dream… math and ND football.
Big thanks to E and Brian (and any other staff involved) for this!
Good to see that Brian and I share the same basic attitude (conference and postseason) regarding what would make college football the most fun – even if realistically none of our opinions will be heeded.
What kind of probation is this?
https://www.espn.com/college-football/story/_/id/30753918/notre-dame-placed-probation-one-year-recruiting-violations
Well right now Notre Dame isn’t displaying the “traits” that the NCAA likes to see so…
This kind:
Houston Griffith is removing his name from the transfer portal and will be returning to ND