

With no game last weekend to recap, let’s check in on Notre Dame’s statistical profile at the midway point of the regular season. In this wild year, what are the Irish doing well to keep winning close games? And where can they find traction to begin pulling away from opponents and increasing the margin of error?
The Big Picture
While things can change, Notre Dame’s profile through six games:
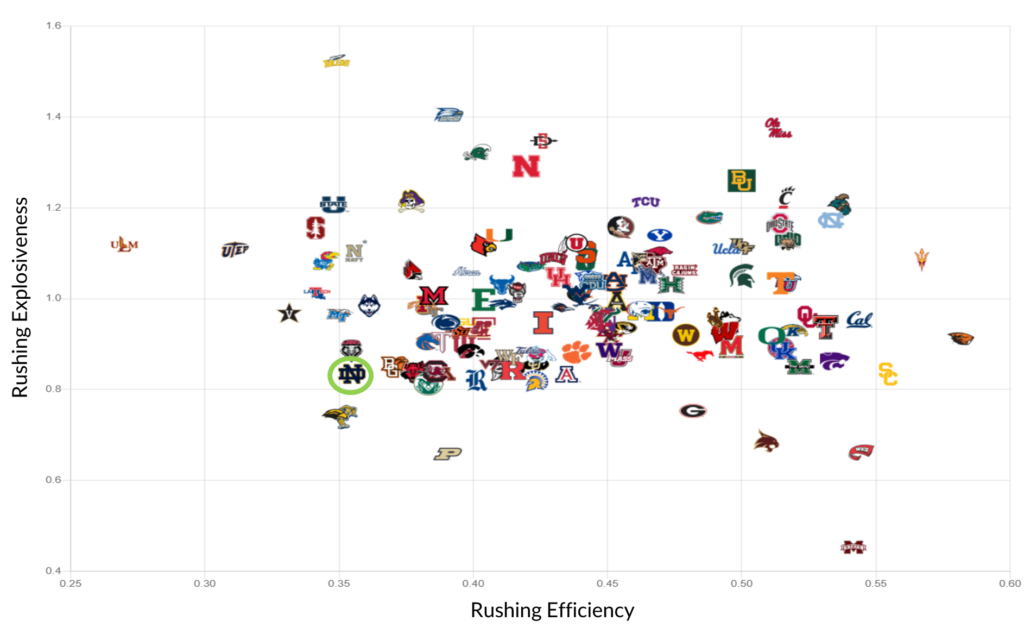
- An erratic offense that is not efficient and highly volatile, with a penchant for explosive plays and costly turnovers
- One of the worst rushing attacks of any power five program – 122nd in EPA/rush and 111th in rushing success rate
- A passing game with decent efficiency (56th success rate) but below-average performance overall (78th EPA/pass) thanks to negative plays (116th in sack rate allowed / 78th in interception percentage)
- A strong defense that has overcome early big play issues to stabilize as a near top-10 unit
- Very stout against the run, 14th in opponent rushing efficiency, 9th in stuff rate, and 16th in power run success allowed
- A little more forgiving versus the pass, 32nd in pass efficiency allowed but making up for it with disruption (T5th in interceptions/game and 13th in passes defended/game)
Across rating systems like FEI and SP+, there’s a consistent view of the Irish as a top 10-20 team, with the defense leading the way as a top 15 unit and the offense trying to claw into the top 40 (likely lower once preseason projections are entirely phased out). Notre Dame’s early strength of schedule is also weighing into opponent adjustments – the Irish opponents are all in the top-40 defenses per F+ except FSU (62nd), including a couple of the nation’s best in Wisconsin and Cincinnati.
FEI has a terrific way to look at the strength of a schedule by projecting how an “elite” (two standard deviations above average), “good” (one deviation), or average team would have given their opponents played. By those measures, the Irish have played something like the 22nd (.98 expected losses for an elite team), 14th (2.34 expected losses for a good team), and 8th hardest schedule (3.95 losses expected for an average team).
The rushing elephant in the room
Even with the rushing renaissance in Blacksburg when Tyler Buchner relived Jack Coan, the Notre Dame offense has miserable running the ball. The offensive line numbers are all bad – the Irish are 100th or worse in line yards, opportunity rate, and stuff rate allowed. This offseason, some NFL draft analysts will foolishly question some “regression” in Kyren William’s numbers, but the backs seem to be doing as much as possible with the space given. Concerningly the offensive line yards are even worse on passing downs than standard downs, indicating that even when defenses are expecting pass the run game still just hasn’t been able to shake loose.
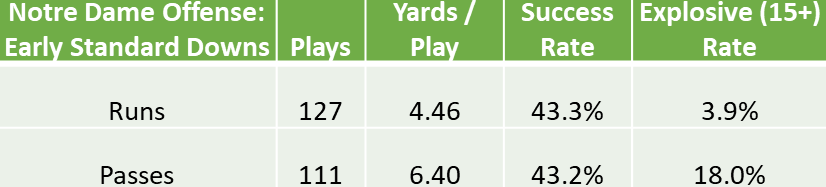
Despite these issues, especially prominent with a non-mobile QB in Coan, Notre dame has run the ball a ton on early downs. The data above shows the difference in rushes versus passing plays in even game situations – 1st or 2nd downs that aren’t obvious passing situations (2nd and 8+ excluded). While the passing game hasn’t been reliable, there’s so much more explosive upside in a healthy sample without sacrificing much efficiency. If Coan continues to play, the Irish offense needs to fully lean into a pass-first identity in his snaps. My fear is that with some softer upcoming defenses and some moderate improvement in the offensive line, the Irish braintrust will continue a nearly 50/50 split on early downs hoping that now finally, Williams and Tyree will have some more breathing room.
A downfield passing game in search of reliability
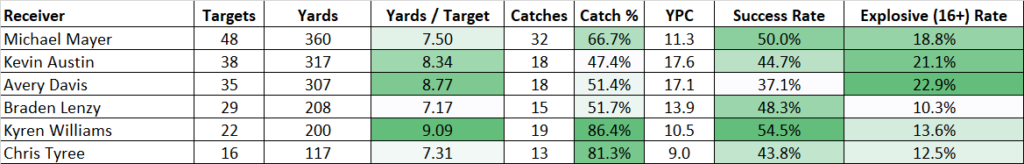
The shift in passing philosophy from Ian Book’s efficiency in the short and medium areas of the field to Coan’s increased downfield looks is evident in the receiving numbers. Last year the top four wide receiver and tight end targets each had a success rate when targeted above 50%, with Javon McKinley and Michael Mayer leading the way at 64%. This season it’s only Mayer breaking that 50% mark among non-running backs.
It’s no surprise the sophomore tight end leads the team in targets, even with his absence at Virginia Tech. Mayer has been more productive on a per-game basis this season, and his big picture numbers like yards per target and yards per catch remain similar to 2020. However, he’s traded efficient targets a season ago for more boom-or-bust looks, with his catch rate down 6%, success rate down 14%, but increasing his explosive play rate by 6%.
Austin and Davis stand out with extremely comparable counting stats and advanced stats. Both have high depth of target averages and have shaky catch and success rates as a result. Still, they’ve been explosive downfield options among the team leaders in yards per target.
Kyren Williams may be struggling to find space in the rushing game, but on a per-target basis he’s leading the Irish in yards per pass target, catch rate, and success rate when targeted. His explosive play rate in the passing game has increased too, up to 13.6% from 10.6% in 2020. Running backs will typically be saddled with poor quality targets as a safety valve with QBs under pressure, making Williams’ numbers even more impressive.
If there’s one shocker, it’s Braden Lenzy bringing up the rear in explosive play rate. That’s not a reflection on Lenzy, who continues to get open downfield consistently. Irish QBs should eventually hit some of those attempts, and it’s heartening to see Lenzy rounding out his game with good efficiency in the short and medium areas of the field.
Easy room for offensive improvement (or regression to start catching up)
The offense remains hard to project moving forward because of so many moving pieces. The offensive line has rarely started the same group in consecutive weeks with the insane run of injuries at left tackle. There’s an entirely different offensive profile with Tyler Buchner at quarterback versus Jack Coan, not to mention some vague in-between version with Drew Pyne. The remaining defenses are collectively so much worse than Notre Dame’s first six opponents.
There are easy avenues to more consistency and success for whoever plays whatever percentage of snaps at quarterback. Clean up the turnovers, where the Irish are 97th in giveaways per game. Reduce the number of negative plays in the rushing and passing game, where Notre Dame is 106th in stuff rate and 112th in sack rate. Convert scoring opportunities into touchdowns and points at a higher rate (97th). This offense is too talented at the skill positions to be languishing at 70th in FBS in point per drive.
Still, if things don’t improve, there are some ominous signs too. The high rate of three-and-outs has the ND offense 103rd in the percentage of available yards gained (from where you start a possession to the opponent end zone). That’s worse than Kansas and only better in the power five than Clemson, South Carolina, Colorado, Rutgers, Vanderbilt, Illinois, and Indiana. Notre Dame is 91st in offensive yards per play. Even if the offense improves against softer defenses, where does that take them – to somewhere around average?
A defense stabilizing before tougher tests
Marcus Freeman’s early 100% approval rating didn’t take long to plummet early this season. In Tallahassee, a mostly dominant performance was marred by long touchdown plays, and the late conservative defense allowed the Noles to rally and send the game to overtime. In the home opener, Toledo joined the big-play party, pairing a few explosive gains with turnovers to nearly pull the massive upset.
Still, in each performance, there were strong underlying indicators this defense could be very good. Opponents weren’t efficient at all and reliant on breaking the big play to score. The Irish were creating a lot of pressure and negative plays. The defense would be in great shape if ND could bend a little more instead of randomly breaking.
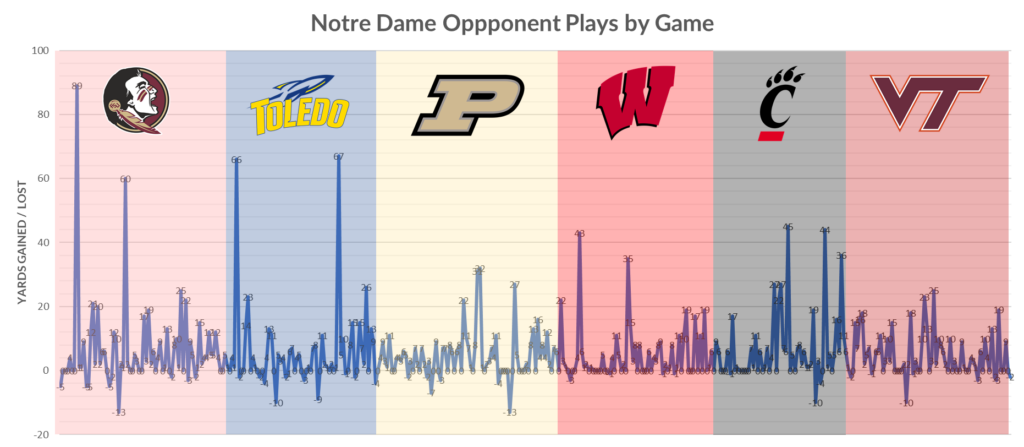
That vision has mostly become a reality, except for a few long passes given up against Desmond Ridder and the Bearcats. It hasn’t come without tradeoffs – Notre Dame’s havoc rate has slowly declined while improving limiting explosive plays. But overall, it’s been a worthwhile tradeoff. This view of the yards allowed by each play of the season in sequence shows the Irish settling into Freeman’s scheme:
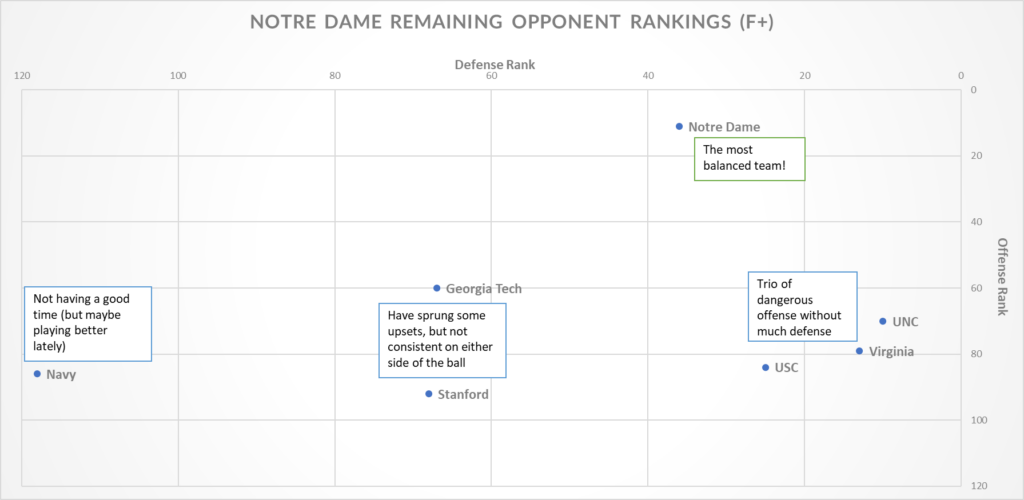
The defense faces the opposite situation as the offense looking at the second half of the schedule. Opponent offenses in F+ are ranked 18th (Cincinnati), 43rd (FSU), 53rd (Purdue), 63rd (Wisconsin), 72nd (Virginia Tech), and 103rd (Toledo). The final six games feature three top-25 units – #10 UNC, #13 Virginia, and #25 USC. While less consistent, the Georgia Tech (#67) and Stanford (#68) offenses have each flashed explosive play ability in upsets like USC, Oregon, and UNC.
A strong defensive backbone meets stronger upcoming opponents
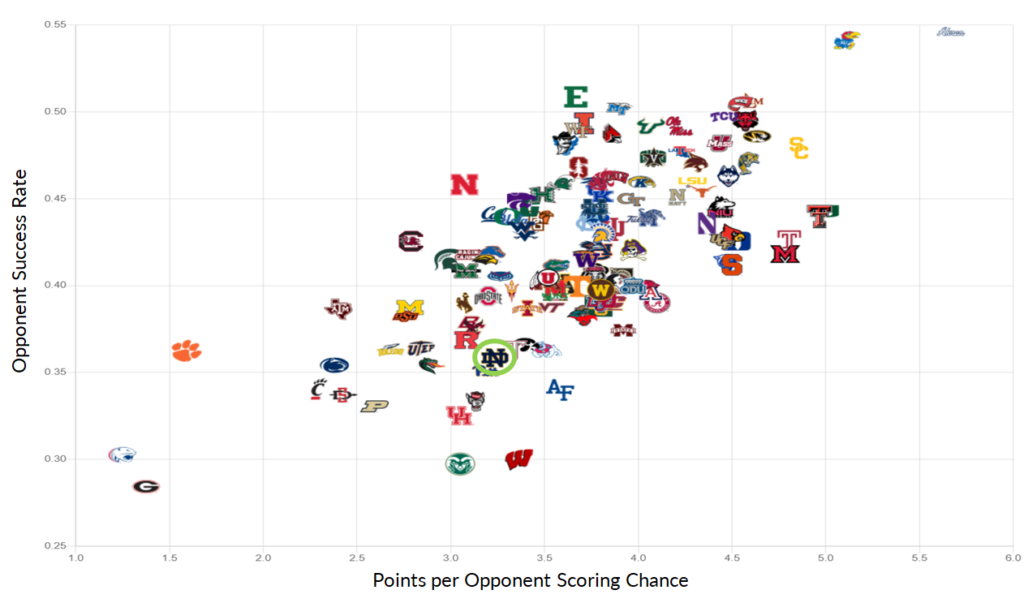
There’s a ton to like about Notre Dame’s defensive profile if the explosive plays are contained. The Irish are top-20 in defensive efficiency, including 14th in rushing success rate. ND has also been stingy limiting opponent scoring chances, giving up just 3.2 points per opponent possession inside the Irish 40. Freeman’s unit is also tied for 6th nationally, forcing 2.3 turnovers per game.
The Irish have picked off 32% of opponent passes that are broken up, which is much higher than the 22% national average, but that has led to only about 3 more turnovers for the season than expected. Those turnovers haven’t been too fluky either – Notre Dame has recovered 4 of 8 opponent fumbles, exactly as expected. While the sacks haven’t been plentiful (58th in sack rate), the pressure has been consistent on opposing quarterbacks.
The big question with the remaining schedule will be how the secondary holds up against a trio of very good passing offenses. Defenses have had success through the first six games picking on the non-Kyle Hamilton and Cam Hart members of the secondary. The Irish defense looked excellent against a Purdue passing attack that shredded Iowa but shaky against Cincinnati and early against a bad Virginia Tech passing game.


This is fun and a great preview for the rest of the season. Gonna be interesting to see our opponents’ defenses get easier while the offenses get harder.
One note: I think the axis labels in the last chart are flipped.
These articles are always appreciated — thanks for the summary of the half-season!