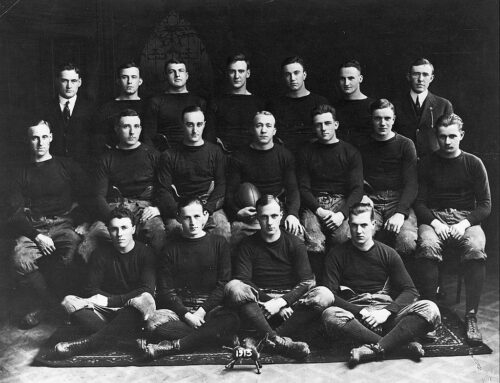
While the program has always pulled athletes from all around the country, the proportions by state have shifted over the years; they have never shifted as much, though, as they have since 1993. From the dawn of the program to the end of the first World War, the roster had a heavily Midwest flavor – the top ten states represented, in order, were Illinois, Indiana, Ohio, Michigan, Wisconsin, Iowa, Massachusetts, New York, Minnesota, and Oregon. From 1919 to the end of the second World War, not that much changed – the top ten in that era were Illinois, Ohio, Indiana, Pennsylvania, New York, New Jersey, Wisconsin, Massachusetts, Michigan, and Minnesota. From 1946 to 1992, the last season before the NCAA reduced the scholarship limit to the current 85, again there were minor shifts but things weren’t tremendously different – the top ten were Illinois and Ohio (tied), Pennsylvania, Indiana, Michigan, California, New York, New Jersey, Massachusetts, and Texas.
Major Recent Shifts in the Roster
Enter the 85-scholarship era, though, and everything changes. The top ten states represented from 1993 to now are Illinois, California, Texas, Florida, Indiana, Ohio, Pennsylvania, New Jersey, Georgia, and Michigan; you’ll note some newcomers in there and some rearrangement. Even more telling than that, though, is each state’s numerical share of the overall players from each era. California has progressed from less than 1% in the early days, to 3% in the interbellum period, to 5% in the post-World-War-II era, to 9% in the modern era. Texas has progressed from 2%, to 1.5%, to 3%, to 8%. Florida has progressed from less than to 1%, to less than 1%, to 2.5%, to almost 8%. Illinois, meanwhile, has gone from 22%, to 20%, to 15%, to 12%. In general, the Midwest’s share of the Irish roster has dipped substantially over the last 25 years while other areas, especially the Southeast, have increased their representation.
What’s Really Behind the Changes?
There are certainly many and complex factors behind these shifts, but I’d put good money on one of them being that the scholarship reductions have forced coaching staffs to go farther afield to find the talent they need to win. Before scholarship limits, the blue bloods of college football could often throw a fence around their respective regions just through volume – they would snag huge numbers of kids, by modern standards, and there was no Hudl or YouTube for those kids to get their highlights out to other coaches. Ara Parseghian pushed Fr. Ted to take 30-35 kids each year; Bear Bryant would bring in 50 or more kids in summer tryouts and of course keep only the best. The advent of NCAA reforms around scholarship limits, as incomplete as they may seem, leveled the playing field considerably; the haves still have far more advantages than the have nots, but they can no longer hoard local talent like they used to.
Another very significant contributor is simply the shift in the US population over this time, which has been mirrored by changes in the roster makeup. The Northeast and the West Coast haven’t changed dramatically over the years, but as the Steel Belt has become the Rust Belt and tech industries have looked south there has been a marked shift in population of the Midwest and the Southeast.
There are any number of potential other causes, as well. Have Florida and Georgia replaced New York and Massachusetts in the top ten because high school football has dipped in popularity in the Northeast and risen in the Southeast? Are there socioeconomic drivers pushing kids to or away from high school football in the different regions? Is there some seemingly unrelated butterfly effect somewhere, such as how the death of the sandlot in New York City’s real estate explosion all but killed its production of baseball talent? If I was a sports-minded sociology PhD candidate (there must be such people out there), I might consider this an interesting thesis topic.
(For more ND state flags, visit proudtobe.nd.edu/wallpaper/state-flags – and let me know if you figure out how to get past Colorado.)


Texas should always be our #1 location. We have a tremendous following in the state and the best HS football in the world is played here
Completely unbiased opinion… Hey, we should hit where the talent is, and the talent is mostly in Texas, California, and Florida. I like what Lyght is doing in Texas, hope he can keep it up.
Texas? Texas??? Only steers and politically incorrect dated jokes come from Texas!
But in all seriousness, we should recruit kids from wherever, including but not exclusive to Texas. Texas only (for the most part) recruits from Texas, and that’s hurt them. When all the kids you get come from the same pool, it’s harder to isolate them for evaluation. It’s good HS football down there no doubt, but as long as we stay out of Fresno I want us to continue to pull from all parts of the country (and get an Aussie punter, while we’re at it.)
I hear you, definitely, but I think there might be a bit of a straw man there if you’re saying that directly in response to Clearwall. He didn’t say we should exclusively recruit Texas, or even try to exclusively pull elite talent from Texas, but rather that Texas should be the most-represented state on our roster. There’s a debate to be had there, for sure; you could make the case for any of California, Texas, or Florida to be #1.
I agree with both of you, actually. We should make a concerted effort in Texas just because of the volume of talent there, and we should diversify because there’s plenty of talent elsewhere too. Hell, look at how we’ve raided western PA this year, which has generally been considered to be on a downswing over the last 20 years or so. You go where the talent is.
Supporting factoids: I just broke down the top 100 players in the 247 Composite. In this cycle, 22 are from Florida (note that this includes IMG kids), 14 are from Texas, 13 are from California, and 12 are from Georgia. They’re the clear-cut leaders – the next state is Tennessee with just 5. So those four states account for 61 of the top 100 kids this year.
Hit it hard, man. Hit it hard.
Oh, yeah, that’s fair–I read too much into his comment.
[…] Previous […]
“What’s Really Behind the Changes?”
Air conditioning
Genius!
Hahaha