
The Notre Dame game run game in 2010 took turns switching between decent and below average. Heading into 2011 the loss of a couple seniors brought plenty of question marks. However, no one could have been ready for the season Jonas Gray would have as a senior. Sadly, his season and college career were cut short but we will remember it fondly here today.
Run Success Definition
A play counts as a success if it gains 40% of yards on first down, 60% of yards on second down, and 100% of yards on third or fourth down. If the team is behind by more than a touchdown in the fourth quarter, the benchmarks switch to 50%/65%/100%. If the team is ahead by any amount in the fourth quarter, the benchmarks switch to 30%/50%/100%.
2011 Rushing Stats
Wood, 217 attempts, 1,102 yards, 5.08 average, 9 TD
Gray, 114 attempts, 791 yards, 6.94 average, 12 TD
Riddick, 14 attempts, 63 yards, 4.50 average, 0 TD
Atkinson, 9 attempts, 27 yards, 3.00 average, 2 TD
McDaniel, 3 attempts, 9 yards, 3.00 average, 0 TD
Of course, there’d be other story lines from 2011 as well. Cierre Wood was coming into his second year of playing and we also saw some early snaps of Theo Riddick at running back and a young George Atkinson making an appearance.
Run Success (2011)
| Player | 1st/2nd + | 1st/2nd – | 3rd/4th + | 3rd/4th – | Total |
|---|---|---|---|---|---|
| Wood | 109 | 85 | 13 | 10 | 56.2% |
| Gray | 71 | 28 | 11 | 4 | 71.9% |
| Riddick | 3 | 8 | 0 | 1 | 25.0% |
| Atkinson | 4 | 3 | 1 | 1 | 55.5% |
| McDaniel | 1 | 2 | 0 | 0 | 33.3% |
Improved Cierre Wood
The main takeaway from 2010 was that Cierre Wood showed some signs of promise as an open field runner but struggled with success rate, particularly later in the season when he became the full-time starter after Armando Allen’s injury. In 2011, Wood really came into his own and improved by leaps and bounds.
Cierre’s yards per carry average only went up by a hundredth of a percent but his success rate shot up 15.9% on an additional 98 carries. It’s still early in this series and I doubt we’ll see anyone improve that much while getting starter reps for an entire season.
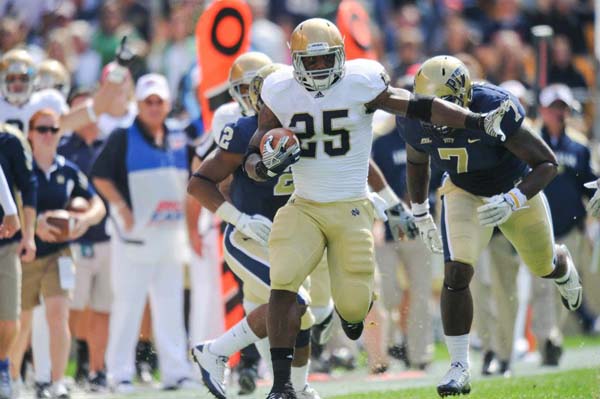
Gray’s Season for the Ages
Jonas Gray put together one of the best seasons in Irish history and that’s not hyperbole. Through the first 8 games of 2011 Gray’s 7.9 rushing average was in the neighborhood of George Gipp’s 8.1 single-season school record before ultimately settling just under 7.0 per carry. More impressively, this wasn’t like Gray boosted his numbers with a handful of really long runs as he only managed 2 carries that went over 30 yards.
The success rate backs up this super impressive season. I can’t imagine many running backs at Notre Dame have ever approached 70% success both because the majority of the post-Holtz era hasn’t been productive enough and the decades prior put too much emphasis on 2 and 3-yard runs as success because grrr imposing your will.
It’s so unfortunate that Gray’s career came to a close in the Boston College game. You have to think his numbers would’ve taken a bit of a dip had he faced Stanford and Florida State, but still. From his touchdown run against Pitt through his final carry at Notre Dame he had 68 successful carries to just 20 unsuccessful carries.
The Rest of the Pack
Theo Riddick had been taking some carries as a receiver going back to the start of 2010 but didn’t move to running back officially until the final two games of 2011 following Gray’s injury. Those two games are included here and were not very successful or foreshadowing Riddick’s strong upcoming senior season.
Atkinson and McDaniel carried the ball so few times that there’s not much to say other than GA3 scoring on a goal line carry against Air Force with his first ever carry.
Other Fun Notes
In the first series I mentioned how Wood was used most often as the rare third and forever “just get some yards back” runner in 2010. The next season, he’d be unsuccessful another 5 plays from 3rd down and 7+ yards. That leaves 5 other failed third down shorter runs and the amazingly sad thing is that 3 of them came in the second half against Michigan. Wood failed a 3rd & 1, 3rd & 3, and a super crucial 3rd & 1 on Notre Dame’s second-to-last series of the game. Wood also lost a fumble in the second half.
From start to finish the game against Purdue was about as thorough of a run game beat down (287 yards, 40 carries, 7.18 average) as we’ve seen under Kelly. Wood and Gray combined for 26 successful runs to just 6 unsuccessful runs. Gray even opened the game with 7 consecutive successful runs before losing a fumble and breaking his streak. This game remains the biggest win over Purdue since 1996.
Speaking of hot starts, the Irish opened up the 2011 Navy game with 11 straight successful runs including 8 straight from Gray. In fact, Gray’s only unsuccessful runs of the entire game were a pair of carries following a holding call to force 1st & 20 as the Irish simply ran out the clock with a huge lead before halftime.
Gray also opened the Maryland game with 6 straight successful runs.
Man, that USC game still stings to this day as the only loss in a 9-game stretch of 2011. Remember the huge recruiting weekend? The hyped night game? The introduction to “Crazy Train”? It was such a huge flop but nothing made the blood boil afterward quite like 22 passes to just 5 running back carries in the first half. Out of those 5 runs only 2 were successful.
When looking through the lens of the run game it’s pretty amazing how good Gray and Wood were in a spread offense with the immobile Tommy Rees at quarterback. Out of all the seasons, this one has always felt like such a huge missed opportunity for Brian Kelly at Notre Dame. In 3 of the losses the Irish went huge stretches of the games completely outclassing their opponents and the other two losses (USC and Stanford) were plenty competitive. With an above average mobile good quarterback with reasonable experience I’d bet this would’ve been a 11-2 team at worst. You might even make an argument (largely based on the presence of Michael Floyd at receiver) with roughly 20% better quarterback play this 2011 team would beat the 2012 team in a 5-game series.
Most Successful Runs in a Win: 27, Purdue & Maryland (tied)
Most Successful Runs in a Loss: 16, Michigan
Fewest Successful Runs in a Win: 10, Pittsburgh
Fewest Successful Runs in a Loss: 5, USC
3rd/4th Down Success Rate: 60.9%

Great series Eric.
Gray’s season is one of my favorite. It gives me hope for the offense this year.
The other tidbit that would be interesting to tie into this would be the OL success rate. Are they tied together?
What do you mean exactly by OL success rate?
Does the RB success rate factor in how the OL plays or would one of the reasons Gray had a great season be a result of the guys he ran behind?
I’m not up to speed on all of the metrics to know if run success % includes the blocking or is it pure effort by the RB?
In short, I would expect Zeke Elliott to be a more successful runner in Dallas than Procise in Seattle simply because he has a much better OL in front of him. Is that factored in or is this purely how awesome the RB is?
Oh, I see what you mean.
This run success is just a flat determination of yards gained. Obviously, the offensive line plays a major part in everything but I’m not sure how to add 5 extra players in to a measurement. You could probably do it watching film and where the back runs, etc. etc. but that would take hours and hours of review and would probably still need a good deal of opinion on differentiating between good/bad blocking and/or good/bad running from the tailback.
I will say this though…
I’ve always tended to side a little more with running back talent vs. offensive line talent when discussing this stuff. Typically, the OL gets the vast majority of the love which is fine but I’ve always thought the intricacies of being a good RB often get swallowed up by “great offensive lines open up holes and that’s that.”
For example, I have the data done through the 2016 season for the Irish and I don’t believe there’s a big drop-off for any running back as he gets older and receives roughly the same amount of carries. Case in point, Josh Adams for 2015-16 will be an interesting example to look at when we get there.
That might speak to Notre Dame’s offensive line talent being a lot more steady and consistent (which the recruiting rankings largely suggest) but I think it also suggests rather strongly that running back “talent” matters a lot too. IMO, if you prove you’re a successful runner with a large enough sample size you tend to stay around that success rate and overcome a possible “weaker” offensive line the following year. At least, that’s my two cents!
Thanks. I was curious, but not curious enough to watch all of the film!
Hughes, Gray and Riddick played the style of RB that I love to watch, so I like seeing statistics show them as “successful.” That’s admittedly a bias though.
I’ll look forward to the rest of the analysis and hopefully a 2017 season that makes the list of most successful running seasons.
Cheers to that!
Cue to BK’s answer in the presser about the style of offense shaping up for 2017. His answer talked to us having this year big-bodied receivers, a very physical O-line, good tight ends, and great depth at running back, and said the reporters could make their own deductions.