In our last installment the 2012 season saw a very rugged yet mostly positive run success as the Irish raced out to a 12-0 regular season. Then, the National Championship Game happened, an internet hoax took over the headlines, and eventually the returning starting quarterback was suspended for the entire upcoming season.
Thus, began the 2013 season for Notre Dame.
Run Success Definition
A play counts as a success if it gains 40% of yards on first down, 60% of yards on second down, and 100% of yards on third or fourth down. If the team is behind by more than a touchdown in the fourth quarter, the benchmarks switch to 50%/65%/100%. If the team is ahead by any amount in the fourth quarter, the benchmarks switch to 30%/50%/100%.
2013 Rushing Stats
McDaniel, 152 attempts, 704 yards, 4.63 average, 3 TD
Atkinson, 93 attempts, 555 yards, 5.97 average, 3 TD
Folston, 88 attempts, 470 yards, 5.34 average, 3 TD
Carlisle, 47 attempts, 204 yards, 4.34 average, 0 TD
Bryant, 3 attempts, 14 yards, 4.67 average, 0 TD
The Irish also lost Theo Riddick and Cierre Wood which meant effectively starting over in the backfield for 2013. Both McDaniel and Atkinson had pretty successful bit roles the previous year but could they be relied upon as the main guys? Would elite recruits in Folston or Bryant make an instant impact?
Run Success (2013)
| Player | 1st/2nd + | 1st/2nd – | 3rd/4th + | 3rd/4th – | Total |
|---|---|---|---|---|---|
| McDaniel | 71 | 65 | 6 | 10 | 50.6% |
| Atkinson | 46 | 39 | 2 | 6 | 51.6% |
| Folston | 47 | 35 | 2 | 4 | 55.6% |
| Carlisle | 16 | 25 | 4 | 2 | 42.5% |
| Bryant | 1 | 2 | 0 | 0 | 33.3% |
McDaniel & Atkinson
As mentioned, McDaniel and Atkinson had nice 2012 seasons with small sample sizes but couldn’t carry the load as well with more carries in 2013. The amount of carries McDaniel received was particularly troubling given his low success rate and far lower rushing average compared to Atkinson.
Of course, the career of Atkinson would come to a close far sooner than we’d realize as he was suspended for the bowl game and promptly turned pro in the off-season. He went undrafted but has stayed around practice squads with Oakland and Cleveland totaling 7 rushing attempts and 15 kickoff returns for his career so far.
McDaniel was a bit of a fan favorite however the stats here backup the decision to cut his carries in half in 2014. He just couldn’t be relied upon to be a consistently good starting running back.
Forever Folston
One of the reasons why McDaniel would be pushed into the background more in 2014 was the bright freshman season from Tarean Folston. However, even this season for Folston was a little deceptive.
He didn’t get going until well into the end of October with an 11-carry performance (6 successful) against Air Force. The next week Folston absolutely obliterated the Midshipmen of Navy. He put up 16 successful runs to just 2 unsuccessful runs–and the Irish almost lost the game!
Still, when you take away that game Folston had a run success rate of 37.5% which is pretty humbling. But all the games count, right?
Carlisle Mistake
I’ll never truly understand why the staff thought Amir Carlisle would turn into a productive running back but they sure tried their best early in the season. He even started his running back career with the Irish putting up 4 successful carries.
However, the offense went to Carlisle two times on third down early in the Michigan game and failed both times. The next week, Carlisle had 8 unsuccessful runs against Purdue and that was effectively the end of his time as consistent rotation tailback. He’d only received 17 carries over the final 10 games.
Other Fun Notes
Many remember this season as the return of Tommy Rees and the heavy passing attack (the offense barely ran over 50% of the plays), especially on third down. In actuality, the 2014 season would be far worse with the throwing on third down, particularly on third and short.
At any rate, the opening game against Temple is a good example of the frustration with this 2013 offense. The Irish opened the game with 10 straight successful runs but also punted twice in the first half thanks to a couple of series full of 3 straight passes. Rees would go 2 of 6 for 3 yards on those two series.
Notre Dame beat Air Force 45-10 but started the game with 7 straight unsuccessful runs.
The success the following week against Navy cannot be overstated. A full 28 successful runs is amazing against anyone but just 4 unsuccessful runs is even better.
The Irish would have two terrible no-good games late in the season for run success and they both directly led to losses. First was the 7 successful to 13 unsuccessful runs versus Pitt in one of the more frustrating losses of the Kelly era. The second was being obliterated by Stanford with a 1 for 12 successful run start. The Irish finished the game with 6 successful runs to 17 unsuccessful carries.
Most Successful Runs in a Win: 28, Navy
Most Successful Runs in a Loss: 12, Oklahoma
Fewest Successful Runs in a Win: 12, Michigan State
Fewest Successful Runs in a Loss: 6, Stanford
3rd/4th Down Success Rate: 38.8%


I was always a fan of Atkinson. I didn’t think he was the greatest RB, but I never understood why fans loved Cam so much more than him (well, I had a theory). The more I think about it though, maybe I just like Atkinson a lot because he was good at 1 thing (long, long runs) while the other RBs were good at 0 things.
The way the staff talked up Carlisle, I had some really high hopes for him. It seemed like he was poised to be the next great ND RB, but he never really had 1 great skill that could make him break through.
WHAT’S YOUR THEORY????
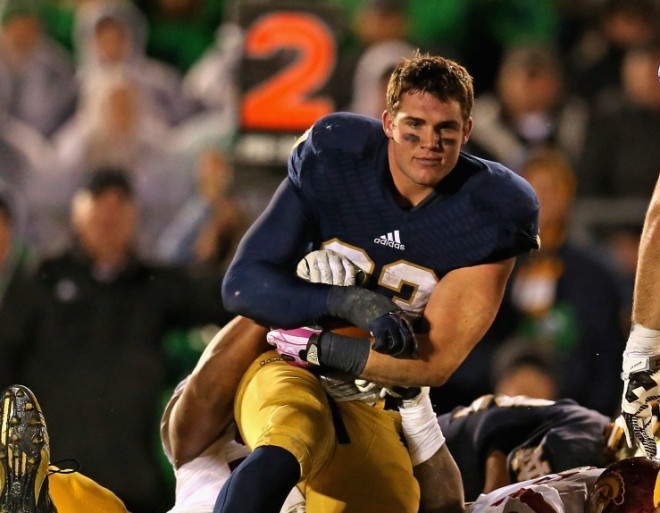
Cam is secretly Brian Kelly’s son. Just look at that header picture. A man that dapper could only be the son of America’s sexiest head coach.
“I never understood why fans loved Cam so much more than him (well, I had a theory)”
He’s an intelligent player. Real heady. Not the best athlete, but always gave it 100%. A real pro’s pro. Gritty. Reminds me of Wes Welker.
The Pitt game was the only time in my life I threw my phone in frustration. I angrily missed the couch I was aiming for and proceeded to watch my phone hurtle into a brick wall. It somehow remained perfectly functional until only a week ago. RIP