
Well folks, it’s time to bring back the advanced stats win probability matrices. I know you missed perusing these rainbow-colored Excel graphics and agonizing (?) over decimal point changes, didn’t want you to miss out on all that fun as the new season gets going. This is going to be an interesting year for comparisons between SP+ and FPI; in past years they’ve generally been in the ballpark of each other side from a couple of games, but this year they’re extremely divergent about Notre Dame. We’re going to get into more detail on that below, but man, does it jump out immediately when you look at these.
Recapping the methodology for these articles: These aren’t actual SP+ win probabilities, as SP+ creator Bill Connelly doesn’t publish those regularly. He does though publish his SP+ ratings every week for all FBS teams. We used a slightly tweaked version of the formula that Reddit poster rcfbuser (account deleted, pour one out) posted a few years back; we’ll get into the formula below when we talk in more detail about the divergence between the models. The FPI win probabilities are updated weekly by ESPN, so those are the real deal.
SP+ measures offensive and defensive explosiveness and efficiency on a per-play basis. FPI is ESPN’s proprietary metric and is much more of a black box, but we do know that it rests heavily on expected points added, which is a pretty solid advanced stat and also a per-play number.
Post-Week 1 Update – SP+ Matrix
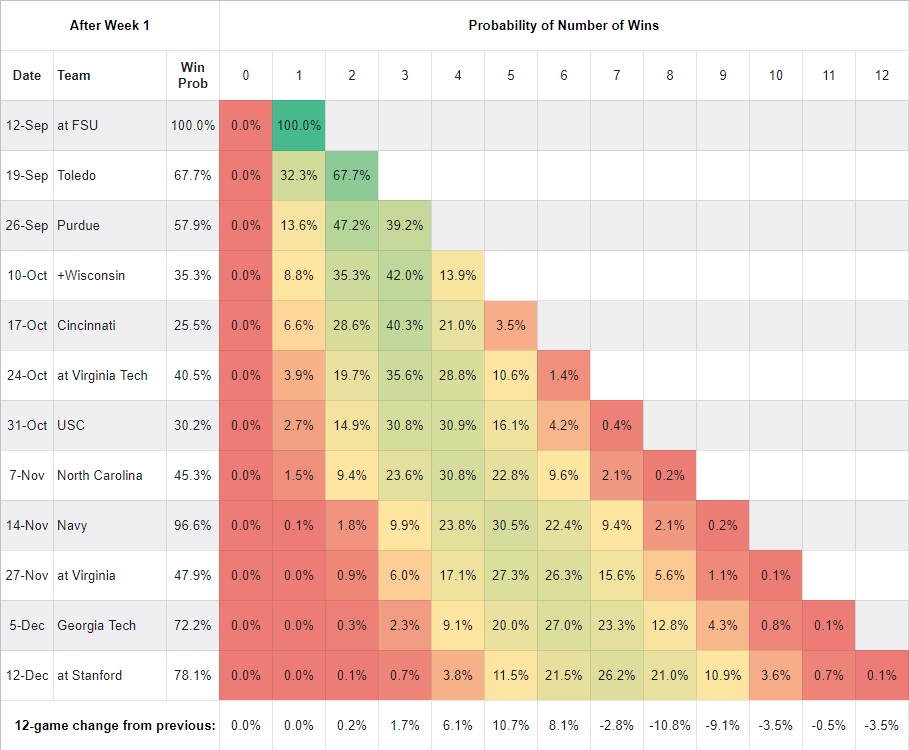
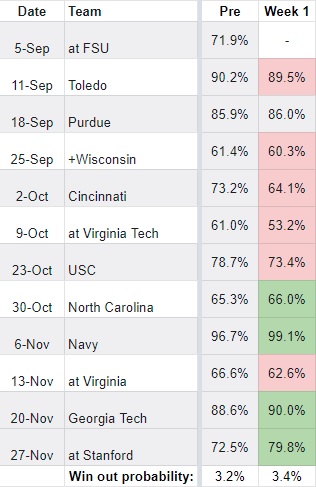
As you move down each column, you find the probability of Notre Dame owning that many wins at that point of the schedule. In the fourth row, for example, you can see that the probability of owning 0 wins through four games is 0% and four wins is 100%, since we already won them. In the last row of the table, we’re tracking how much the probability of each win total has changed from the previous week. This is a function of our own outcomes, the quality of play that led to those outcomes, and SP+’s changing perceptions of our past and future opponents.
The 0.1% figure at the end of the Wake Forest row reflects our probability of winning out per SP+. That’s down 3.4 points from the previous week, primarily because SP+ super duper hated Notre Dame’s performance in the Florida State game – the team’s raw SP+ score dropped from 17.1 to 11.0, which is a massive one-week swing. That in turn meant that games SP+ already considered difficult are now considered extremely difficult. I think USC and Cincinnati are tough matchups too, but how many of us truly believe that Cincy would take three out of four or USC would take seven out of ten in South Bend? It’s odd. Like I said, we’ll dig into it a bit more below.
Post-Week 1 Update – FPI
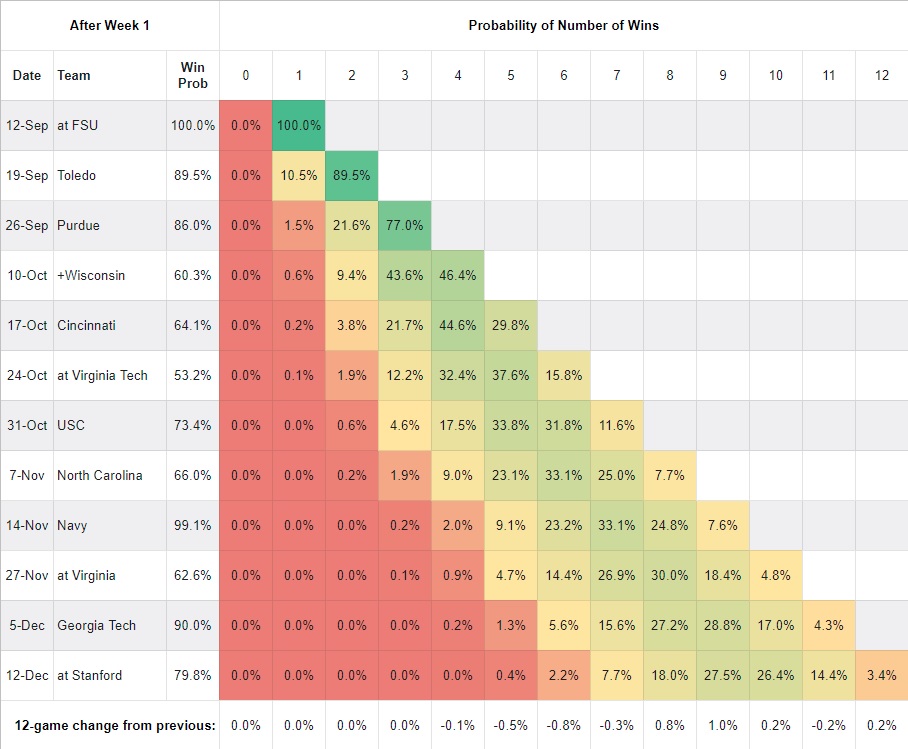
FPI was basically unperturbed by the Florida State game; coupled with its generally more positive opinion of the Irish, it kept the win-out chances pretty stable at 3.4%. In fact, on average, FPI’s game probabilities are 20 percentage points higher than SP+’s. What gives?
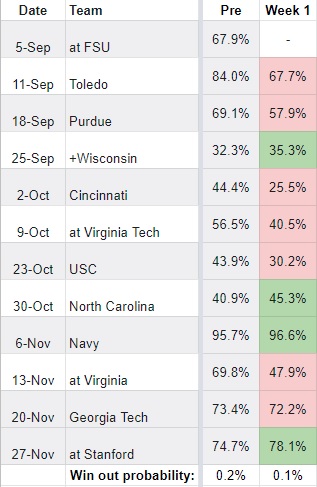
Week by Week Game Trends
| SP+ | FPI |
|---|---|
 |
 |
Putting the differential in more stark relief here… The comparison between Notre Dame eking by Florida State and Cincinnati pummeling of Miami-Ohio was somehow enough to improve the Bearcats’ SP+ win probability in South Bend from 56% to 74%. Similarly, SP+ felt that USC’s comparative performance in a 30-7 win over San Jose State, which was 13-7 at the end of the third quarter, moved their win probability – again, in South Bend – from 56% to 74%. Perhaps most questionable is that Virginia’s shutout of FCS William & Mary improved their raw score from 5.8 to 9.4, which when combined with Notre Dame’s drop meant their win probability shot from 30% to 52%. Huh?
FPI shifted too, in most cases in a similar direction to SP+. You would expect that when the Irish post an underwhelming performance. It’s the magnitude of the shift in SP+, and where some of the preseason win probabilities were, that’s really hard to understand.
Digging Deeper
Part of the delay in getting this feature going again was that I couldn’t figure out how to tweak the SP+ approximation formula I use for this season. Each year I adjust it a little bit to get my preseason win probabilities close to the ones Connelly publishes; generally it’s very straightforward, just changing one constant, but this year I couldn’t work it out. There was no simple, universal change I could make that made all the win probabilities align with the official ones. I start with the difference between the two teams’ published SP+ scores, adjust for location (+2.5 if it’s at home, -2.5 if it’s on the road, 0 if it’s neutral site), and divide by a constant. Then I plug that number into the normal distribution function to get the win percentage.
In Google Sheets, the formula looks like this: norm.s.dist(([SP+ rating for ND]–[SP+ rating for opponent]+[homefield adjustment])/17). The 17 is a generally accepted starting point – I’m not the only one doing this, after all – that I tweak slightly from year to year. For example, last year I got closest to Connelly’s numbers when I used 17.8. It’s not usually a big tweak.
This year, doing the same operation, I couldn’t get one set of games to be near the real numbers without getting another set way off. The Purdue, Wisconsin, Cincinnati, USC, North Carolina, and Georgia Tech games were all problematic. I went back to 17 and was reasonably close on all the other games, so I started tweaking the constant for the problem games. Again, there was no one tweak that solved for all of them; in the case of Cincinnati, there was no tweak that solved it at all. Preseason, Connelly had that game as a 44% win probability for Notre Dame. That didn’t make much sense, given that Notre Dame’s SP+ rating was 17.1, Cincinnati’s was 17.0, and the game was in South Bend – the homefield advantage should’ve tilted the probability to the Irish. In fact it was exactly backwards from what you’d expect – using the “normal” formula, you would get a 44% win probability for Cincinnati.
And that’s when it clicked. The problematic games are all home games plus the one neutral site with Wisconsin. I set the constant back to the standard 17 for those games; removing the homefield advantage for the USC and UNC games, reversing it for the Purdue, Cincinnati, and Georgia Tech games, and treating Wisconsin as an away game then brought all of my win probabilities for those games to less than one percentage point off Connelly’s numbers.
Why? I have no idea. It could be coincidence – it’s a hell of a coincidence across six games, but still, it could very well be. It could be that there are other adjustments Connelly does that happen to have the same effect as reversing or removing the homefield calculation. In the case of the Wisconsin game, the Badgers are nominally the home team and it could be a simple administrative oversight that makes the finding less comprehensive and thus less persuasive.
Or it could be that Connelly, and by extension SP+, thinks Notre Dame doesn’t merit a true homefield advantage for whatever reason. That seems exceedingly odd when you consider that the Irish have won 24 at home, with their last home loss coming by one point to a 2017 Georgia team that would lose the national championship game in overtime. But I’m a simple man, and I might just not understand such things.
Intuitively, the FPI numbers make a lot more sense. I’ll be very interested to track how these numbers change over the course of the season.
Heh Stanford 78% win probability per SP+ while Toledo is just 68%. David Shaw is having a bad time, and that makes me so happy.
He’s doing God’s work in Palo Alto.
I’m at a point where I don’t know which firing would make me sadder: Shaw or Helton.
Easy call – Helton
He’s finally getting around to returning Stanford football to what it’s supposed
Is he not giving out any homefield advantage to anyone? If so, perhaps he was (at least during the summer) operating on some kind of covid assumption where there would be few fans in the stadium. I thought I had read somewhere last year or after the season (not even sure which sport the analysis was done on) but that since homefield advantage comes form the crowd, when there is no crowd, there is no advantage.
Last year he started at +/- 1 for homefield, under theory that crowd or not there is still an advantage to being at home (no travel, familiarity, etc.). He adjusted it to +/- 2 midway through the season because he found the effect even in empty stadiums was weakened less than expected.
I didn’t see if it was back to +/- 2.5 this year but setting it to that makes stuff align, so I would assume it is. Note that all our road games are accurate using -2.5, and three of the “problematic” home games are -2.5, not 0. Like I said, it could be something else we’re not aware of, but it certainly looks like homefield calculations are still there.
So the most surprising stat on both of those is the Virginia game. They are right up there with Cincy and Wisconsin (FPI). Virginia Tech at least makes some sense since we’ve seen them beat UNC – though it is still surprising FPI has VT as our toughest opponent right now.
Virginia is probably decent, and that one is on the road (as is VT) while Cincy is home and Wiscy is neutral.
Haha well I just noticed this column. Was it here earlier when I commented in the Toledo post? I would assume so.
Well again the SP stuff is pretty sobering, hopefully FPI is much closer to reality. Between 6-8 wins would really suck.
Would be curious how the game would have been viewed had ND held on 38-20ish. At that point FSU had single digit successful offensive plays.
Ha, no, I wrote it up today. I really was fighting with the formula.
EDIT: I think SP+ would’ve liked the game a lot better. Not sure it would’ve liked it enough to change its preseason pessimism of us, but we’ll never know.
Well thanks for putting these together I do enjoy and look forward to them, even moreso during the 12-0 years.
“In the fourth row, for example, you can see that the probability of owning 0 wins through four games is 0% and four wins is 100%, since we already won them.“
This might be part of the reason why you’re fighting the formula.
KIDDING.
Just trying to help by pointing out one typo. Please don’t research my lifetime of typos, it’s an infinite rabbit hole.
SP+ looking pretty accurate