
I haven’t worked on this since Cincy’s stinkin’ Bearcats ruined everything. And thank you so much for bringing up such a painful subject. While you’re at it, why don’t you give me a nice paper cut and pour lemon juice over it? We’re closed!
 Definitely a Notre Dame fan.
It was a rough one. As my esteemed colleague pointed out, the Irish offense wasn’t efficient and wasn’t explosive and attempted to address those issues by shooting itself in the foot repeatedly. Sounds like a pretty fun day at the office, no? Even so, our dedication to bringing our dear readers quality content necessitates another foray into the morass of Notre Dame’s 2021 season. Feel the enthusiasm, folks.
Recapping the methodology for these articles: These aren’t actual SP+ win probabilities, as SP+ creator Bill Connelly doesn’t publish those regularly. He does though publish his SP+ ratings every week for all FBS teams. We use a slightly tweaked version of the formula that Reddit poster rcfbuser (account deleted, pour one out) posted a few years back to approximate the official calculation. The FPI win probabilities are updated weekly by ESPN, so those are the real deal.
SP+ measures offensive and defensive explosiveness and efficiency on a per-play basis. FPI is ESPN’s proprietary metric and is much more of a black box, but we do know that it rests heavily on expected points added, which is a pretty solid advanced stat and also a per-play number.
Post-Week 5 Update – SP+ Matrix
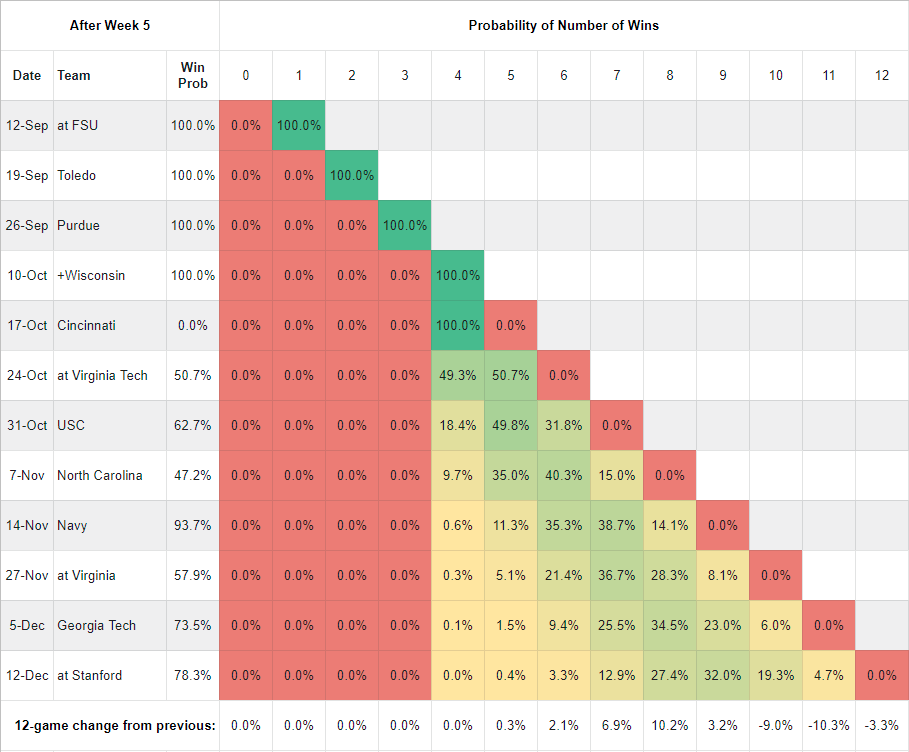
As you move down each column, you find the probability of Notre Dame owning that many wins at that point of the schedule. In the fifth row, for example, you can see that the probability of owning 0 or 5 wins through five games is 0%, and of owning four wins is 100%. So, 4-1. In the last row of the table we’re tracking how much the probability of each win total has changed from the previous week. This is a function of our own outcomes, the quality of play that led to those outcomes, and SP+’s changing perceptions of our past and future opponents.
The 4.7% figure at the end of the Stanford row reflects our probability of winning all the remaining games per SP+. The probability of going 11-1 is down 10.3 points from the previous week, which is a really big swing for one week. Interestingly, Notre Dame’s raw SP rating climbed slightly, from 13.4 to 14.0, but the ratings for almost all remaining opponents went up more.
Post-Week 5 Update – FPI

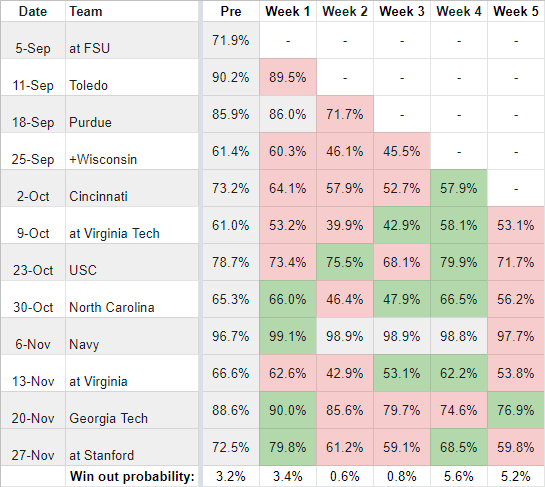
FPI, as usual, is less bearish on the Irish but was also pretty bummed out by the game. You’ll notice a marginally better probability of winning out – 5.2% vs. 4.7% – but what really jumps out is a massive drop of over 15 points in the likelihood of going 11-1. Yay. If there’s some consolation here it’s that both metrics see a 1 in 4 chance of going 10-2 or better, which isn’t terrible. Again, yay.
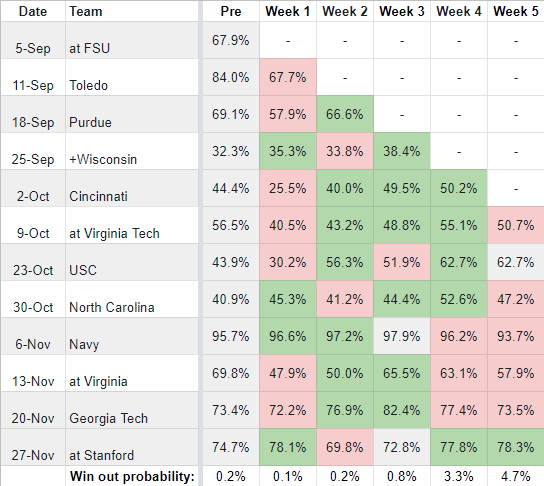
Week by Week Game Trends
| SP+ | FPI |
|---|---|
 |
 |
Yes, I double-checked the SP+ number for Stanford, who just beat Oregon, a couple of times. Stanford got one interception on three passes defensed (which is slightly lucky from SP+’s perspective), plus Oregon turned it over on downs at the Stanford 1 just before halftime, plus Oregon had a small yards per play advantage (5.2 to 5.0). So that’s my guess there – that SP+ views it as a game Oregon “should” have won and doesn’t give Stanford as much credit for it. Hope they’re right.
Georgia Tech got hammered by Pitt, so it’s not surprising that the Irish’s win probability in that game went up a bit per FPI. As to why it still went down per SP+, I don’t know. The only thing I can think of there is that SP+ was very impressed by Georgia Tech’s performances against North Carolina and Clemson, and those weigh heavier with one more chunk of preseason projections coming out of the equation.
It’s also worth pointing out that the per-game delta between SP+ and FPI is narrowing – the average difference between them for the remaining schedule is now 1 point, where last week it was 4 and a few weeks ago it was 20.


I’m surprised at how much the formulas like the Hokies…both give ND just a small edge. Now I just have to figure out a way to get the ACC network
I’m gonna have to make up a burner email because i’ve already used up my “free trials” of Sling, fubo, etc.
After a game that bad, I’m just glad to see that our chance of an undefeated season only went down by 3.3%.
“Yes, I double-checked the SP+ number for Stanford, who just beat Oregon, a couple of times.”
Where in the article can I find Stanford’s SP+ ranking? Or am I grossly misunderstanding something?
I meant the win probability, which went up half a point despite our respective game outcomes. Poorly worded.
I guess this week is pretty crucial. Seems like the ND beat writer vibe is still “10-2 is likeliest”, which is not true by the numbers… but if we win this weekend it then might be.
A win next week would give us a 33% chance of 10-2 or 11-1 per SP+ and a 40% chance per FPI. SP+ would still have 9-3 as the most likely outcome, which is not surprising given how much it likes North Carolina.